The Changing Face of Chemistry 2022-23
How Has Structural Chemistry Data Changed in the Past Year, and What Does It Mean for Future Research?
The annual statistics have just been released from the Cambridge Structural Database (CSD); summarizing the small-molecule and metal-organic structures published in the past year. This data gives unique insights into the changing face of chemistry. Here we look at how structural chemistry data changed in 2022 vs previous years.
The Vital Role of Data in Chemistry Research
Access to trusted, curated, accessible, and interoperable chemical structure data has transformed scientific research. Diverse fields from drug discovery and development to functional materials, agrochemicals, and beyond use chemical databases to inform, guide, and inspire novel work. Trusted, curated data is the foundation for AI and ML approaches which continue to grow across diverse chemistry research areas.
Databases such as the CSD are valuable to researchers who can draw insights from chemistry that has already been observed such as What is “normal” for this bond length? What structures like mine exist, and what are their properties? What interactions are likely to be observed with this structure?
Uses of the Cambridge Structural Database
The CSD is the world’s largest repository for small-molecule organic and metal-organic crystal structures. Over 1.2 million structures have been curated since 1965, and are used today by top pharma, biotechs, and academic researchers to fuel novel research. The contents of the database may be taken as a measuring stick for changes in focus and priorities within chemistry research.
Key Observations from the Statistics
- The total database grew by 5% (data from published literature and via CSD Communications)
- There was slight slowing in growth of structures containing metals this year than in previous years
- Studies at low and high temperatures continue to grow at a faster rate than room temperature data collections
- Structures solved by neutron studies have decreased, perhaps reflecting the increasing popularity of electron diffraction methods and/or a delayed effect of the COVID-19 lockdowns
- Disordered structures continue to increase.
Full Statistics
Explore the full statistics:
- CSD Space Group Statistics – Space Group Number Ordering
- CSD Space Group Statistics – Space Group Frequency Ordering
- CSD R-factor Statistics
- CSD Publication Year Statistics
- CSD Journal Statistics
- CSD Entries: Summary Statistics
- CSD Crystal System Statistics
- CSD Author Statistics.
| Metric | Structures (January 2023) | Change cf. 2022 | Change cf. 2021 | Change cf. 2020 | Change cf. 2019 | Change cf. 2018 |
| Total No. of structures | 1235232 | 5% | 5% | 6% | 6% | 6% |
| No. of different compounds | 1109868 | 5% | 5% | 5% | 5% | 6% |
| No. of literature sources | 2058 | 0% | 1% | 1% | 1% | 14% |
| Organic structures | 550745 | 5% | 6% | 6% | 6% | 7% |
| Transition metal present | 581041 | 4% | 5% | 5% | 5% | 5% |
| Li – Fr or Be – Ra present | 60769 | 5% | 6% | 6% | 6% | 4% |
| Main group metal present | 128883 | 5% | 6% | 6% | 6% | 5% |
| 3D coordinates present | 1168675 | 5% | 5% | 6% | 6% | 6% |
| Error-free coordinates | 949512 | 1% | -1% | 0% | 2% | 6% |
| Neutron studies | 2545 | 2% | 5% | 3% | 6% | 3% |
| Powder diffraction studies | 4773 | 0% | 0% | 0% | 0% | 3% |
| Low/high temp. studies | 675,320 | 8% | 6% | 8% | 8% | 8% |
| Disorder present in structure | 342250 | 6% | 7% | 7% | 7% | 8% |
| Polymorphic structures | 38375 | 5% | 10% | 5% | 5% | 6% |
| R-factor < 0.100 | 1185360 | 5% | 5% | 6% | 7% | 6% |
| R-factor < 0.075 | 1072641 | 5% | 5% | 5% | 8% | 6% |
| R-factor < 0.050 | 707829 | 5% | 5% | 6% | 7% | 7% |
| R-factor < 0.030 | 173337 | 5% | 6% | 6% | 16% | 7% |
| No. of atoms with 3D coordinates | 105821374 | 5% | 6% | 6% | 3% | 10% |
Data Origins
All the data in the CSD is from experimentally observed crystal structures. This is gathered from the published literature, or by direct publication from the scientist (as a “CSD Communication” with no associated paper).
Each structure then undergoes manual and automated curation to make it more accessible for human and machine use (following the FAIR data principles; findable, accessible, interoperable, reusable).
- To date, 165 journals have contributed more than 500 structures to the CSD
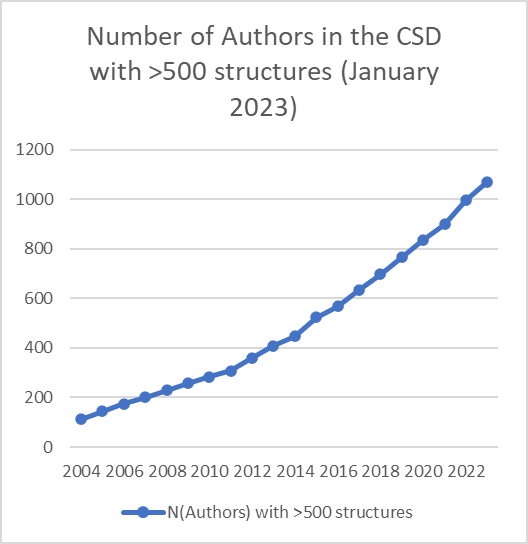
- To date, 1,070 authors are cited in 500 or more CSD entries
- The data has been curated since 1965, but includes structures solved from 1923 onwards.


Data Complexity and Precision
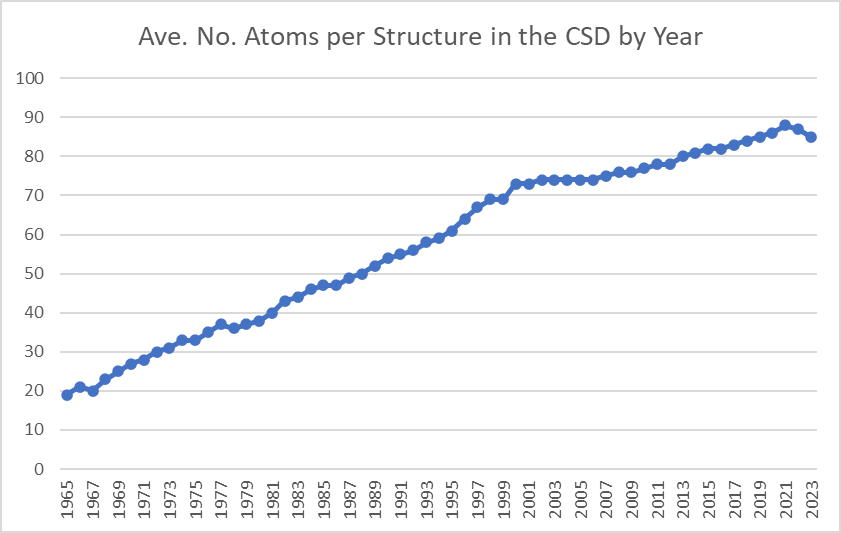
The number of atoms per structure has steadily increased since 1965, reflecting improvements in x-ray crystallography and other analytical techniques. However, this peaked in 2021 and a slight decrease is observed in the last 2 years. However some of the most complex structures (with the most atoms per structure) take longer to add to the CSD, so the downturn might flatten out.

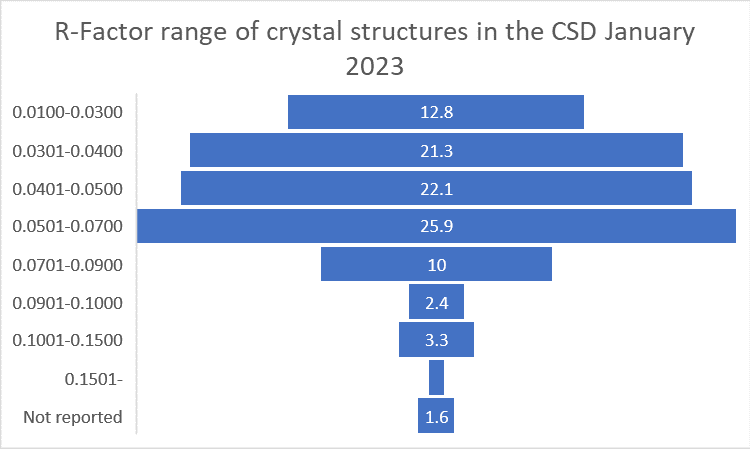
The precision of the data is assessed by the crystallographic R-factor, which measures how well the structure factors computed agree with structure factors given by experimentally observed diffraction intensities.
The data shown represents all data in the CSD to date. Structures with unreported R-factors often arise from short communications or very early literature.

The proportion of structures having the highest category of precision has changed little in the previous 5 years. Despite the rise of electron diffraction as a method this hasn’t yet impacted on overall trends in the data.
| R-factor range | % CSD 2023 | % CSD 2022 | % CSD 2021 | % CSD 2020 | % CSD 2019 |
| 0.0100-0.0300 | 12.8 | 12.7 | 12.5 | 12.4 | 12.3 |
| 0.0301-0.0400 | 21.3 | 21.3 | 21.2 | 21.2 | 21.2 |
| 0.0401-0.0500 | 22.1 | 22.2 | 22.2 | 22.3 | 22.3 |
| 0.0501-0.0700 | 25.9 | 26 | 26.1 | 26.2 | 26.3 |
| 0.0701-0.0900 | 10 | 10 | 10 | 10 | 10 |
| 0.0901-0.1000 | 2.4 | 2.4 | 2.3 | 2.3 | 2.3 |
| 0.1001-0.1500 | 3.3 | 3.3 | 3.2 | 3.2 | 3.1 |
| 0.1501- | 0.7 | 0.7 | 0.6 | 0.6 | 0.6 |
| Not reported | 1.6 | 1.7 | 1.8 | 1.9 | 1.8 |
Next Steps
- Explore the full statistics:
- Learn more about the CSD and how it can impact your research.
- Register for a webinar to learn more about the applications of the CSD data and software.