Insights into drug-like compounds from crystal data
As the size of the Cambridge Structural Database (CSD) has just passed one million structures, it seems an appropriate time to look at some of the applications of this ever-growing resource. Whilst the CSD is certainly useful as a central record of past data collections, perhaps the more significant benefits are the insights that can be gained from looking at this mass of data as a whole. In this blog, I’ll show some examples of what can be discovered from statistics generated from the CSD when looking at drug-like compounds. A paper written by CCDC colleagues with researchers from Pfizer and AstraZeneca (Journal of Pharmaceutical Sciences, Volume 108, Issue 5, 2019, Pages 1655-1662, https://doi.org/10.1016/j.xphs.2018.12.011) gives an in-depth statistical analysis of drug compounds in the CSD.
The search for new pharmaceutical compounds is a vitally important task for society. A great deal of industrial and academic research is devoted to finding both molecules with a desired biological activity; and also, perhaps the more challenging task of finding the molecule with the best properties for practical medical use in the real world. This challenge is far wider reaching than just the biological activity, the molecule must also be easy to synthesise and be stable under a range of conditions, including factors such as temperature and humidity.
The CSD contains thousands of structures of drug-like molecules, by looking at these and comparing them to a wider range of organic compounds, it’s possible to observe and confirm many insights into what is required for a ‘drug-like’ compound. Those working in the pharmaceutical industry will know all too well how challenging it can be to publish research on compounds of research interest, and so the CSD is invaluable in collecting together all the structural data that has been published in both the scientific literature and patents from both industry and academia. Collecting this information together in the CSD can also help to identify the directions in which the drug industry is headed.
For my investigation I’ll use the CSD Python API on three different subsets of CSD data. Firstly I’ll look at CSD structures that feature in the DrugBank database. DrugBank contains a large range of drug data, including details of over 2,500 approved small molecule drugs. The CSD contains links from any entry that has a corresponding DrugBank resource.
Secondly, I’ll use a collection of CSD entries where we’ve recorded potential biological activity. This is a wider set of information gleaned from the publication literature and will include natural products and experimental compounds where the authors have investigated some aspect of the structure’s impact on a biological source – this will encompass anything from antibiotic activity to herbicidal properties.
The final dataset to compare with is organic structures in general. This covers just under half of all the entries in the CSD.
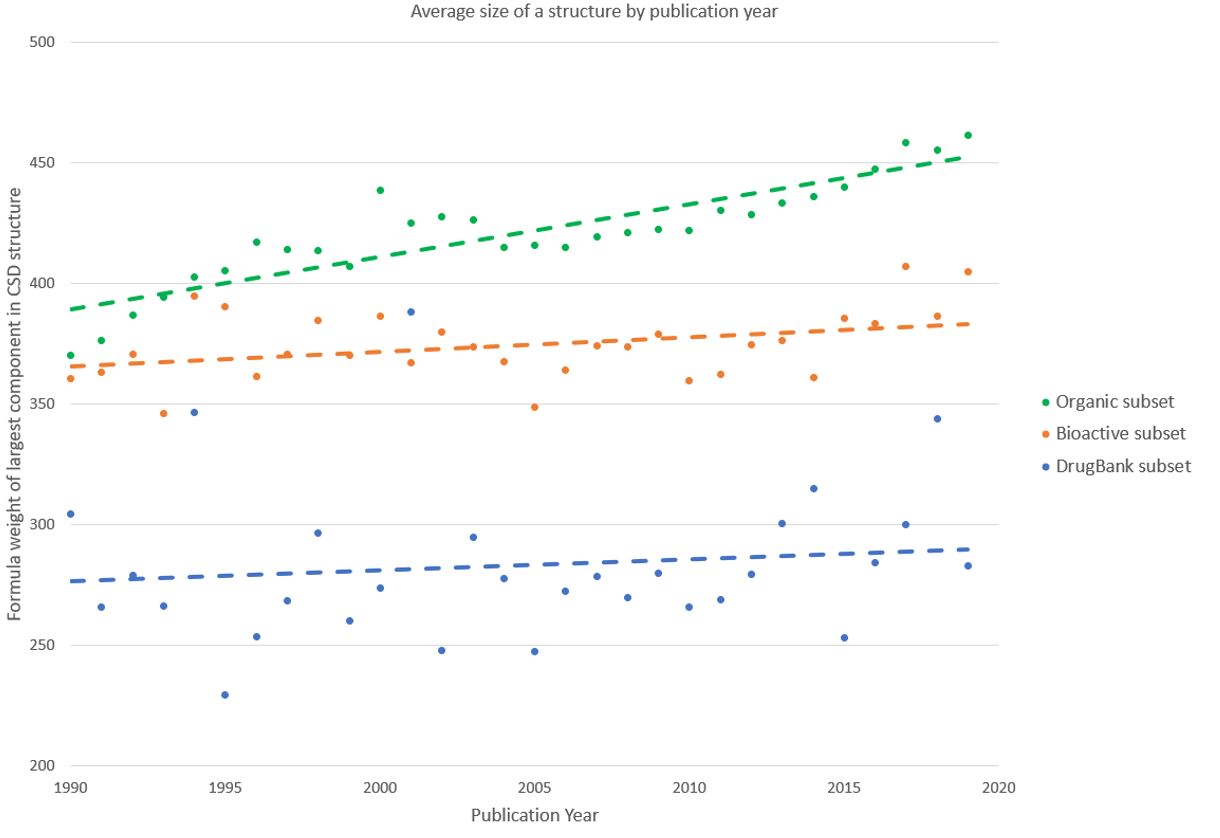
A trend that has been seen across the CSD as whole is that of increasing complexity. The chart below shows the average size of the heaviest component of a structure (thereby ignoring any solvent molecules or counterions) for the three datasets we’re looking at.
Figure 1: Chart of average molecular weight of CSD entries by year of publication
The trend of increasing complexity seen in the CSD is certainly also observed for the subset of organic structures. This may be explained by improvements in diffraction equipment and refinement software that allow scientists to model complex structures that were previously too challenging to tackle. The trend is, however, less obvious for the more drug-like subsets of molecules, and this insight is worth investigating further – could this tell us about the types of compounds used medicinally?
One way that is commonly used to assess if a molecule is ‘drug-like’ is to use the well-known Lipinski’s Rule of Five. These rules are based on observations of the features of orally administered drugs, and it’s considered that candidate drugs that conform to these rules have a better chance of succeeding in clinical trials. The rules look at the number of hydrogen bond donors and acceptors as well as the molecular mass and a measure of lipophilicity. We can already see some truth in these rules from the chart above – generally the drug-like molecules are smaller than the ‘average’ organic molecule.
Looking at the number of hydrogen bond donors and acceptors from our subsets in the CSD gives us more evidence that Lipinski’s Rules in this area are broadly correct. The charts show equally sized groups of the three subsets plotted on heatmaps with the same plot area, and where the green dotted lines enclose the area in which Lipinski’s Rules are satisfied.
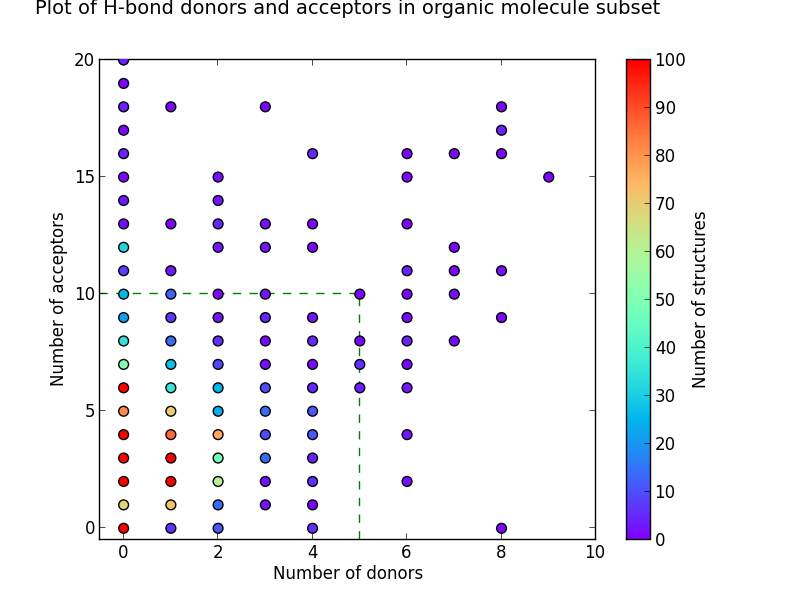
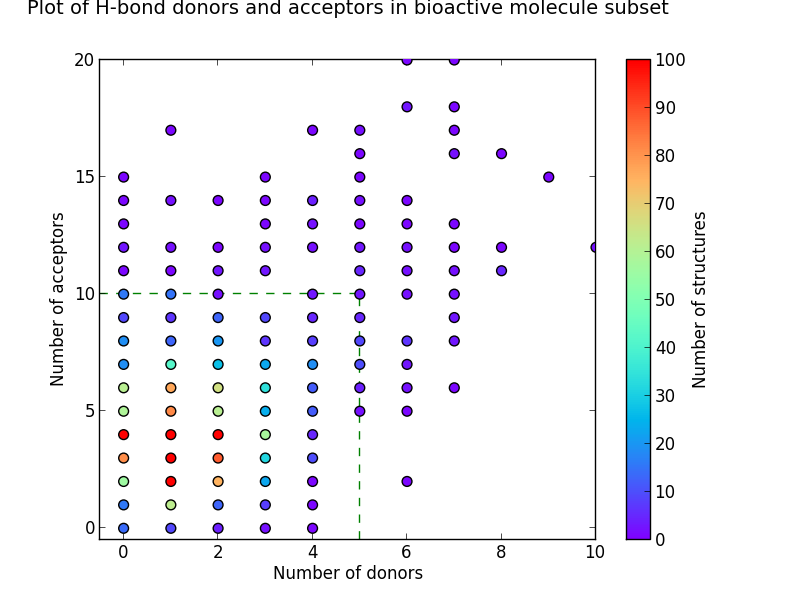
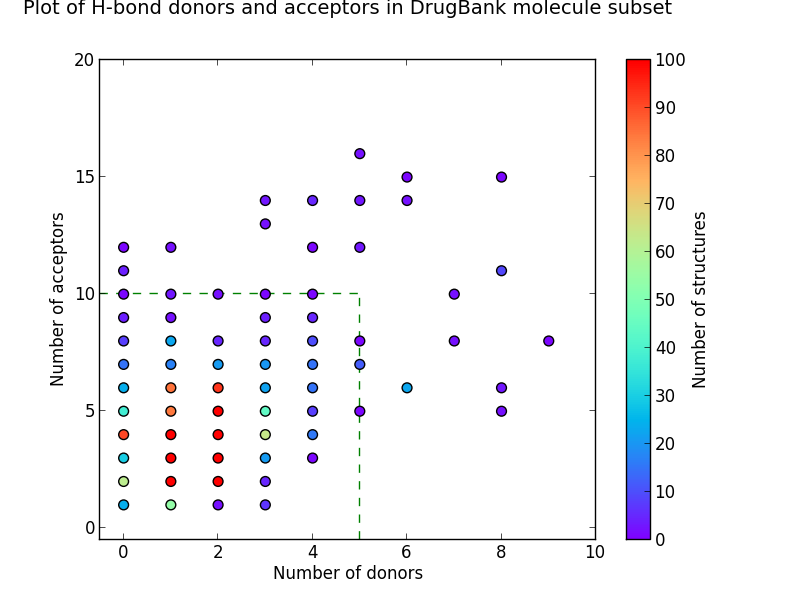
Figure 2: Heat-maps showing the number of hydrogen-bond donors and acceptors
It can be seen from these plots that the more drug-like the subset, the greater the proportion of molecules enclosed within this area. It’s also apparent that drug-like molecules have much lower numbers of structures with no H-bond donors and acceptors when compared to organic molecules in general. Although the heat-maps for the bioactive and DrugBank subsets are broadly similar, a greater proportion of the bioactive molecules fall outside the box that satisfies Lipinski Rule criteria.
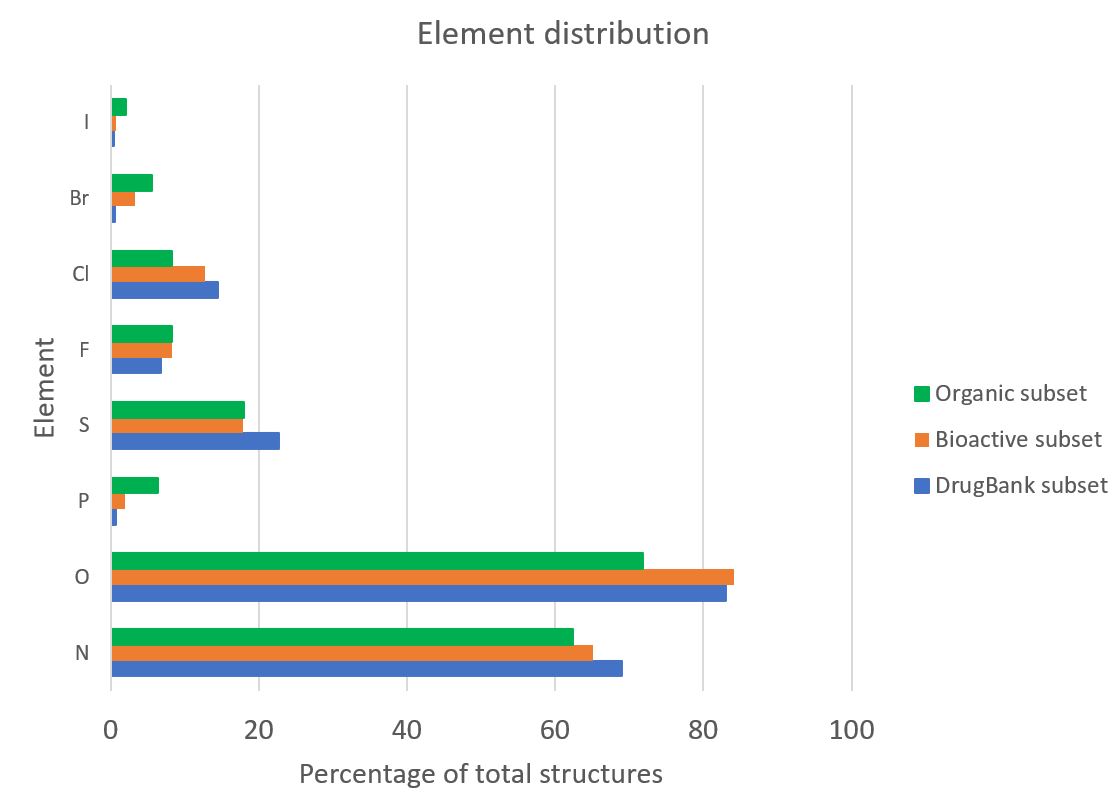
Another common feature reported for drug-like molecules is a specialised range of functional groups and elements used to help confer desirable properties. Such insights into the elemental composition of different subsets of structures are easy to investigate from the CSD. The chart below shows an analysis of the elements contained within the heaviest component of a structure from each of the three subsets; a few features are immediately apparent. An increased proportion of nitrogen and oxygen in the drug-like subsets correlates with our previous finding of an increased number of H-bond donors and acceptors in such compounds. It can also be seen that drug-like molecules are more likely to contain chlorine than heavier halide elements, and much less likely to contain phosphorus than the ‘average’ organic molecule in the CSD.
Figure 3: Chart showing the occurrence of elements within CSD entries
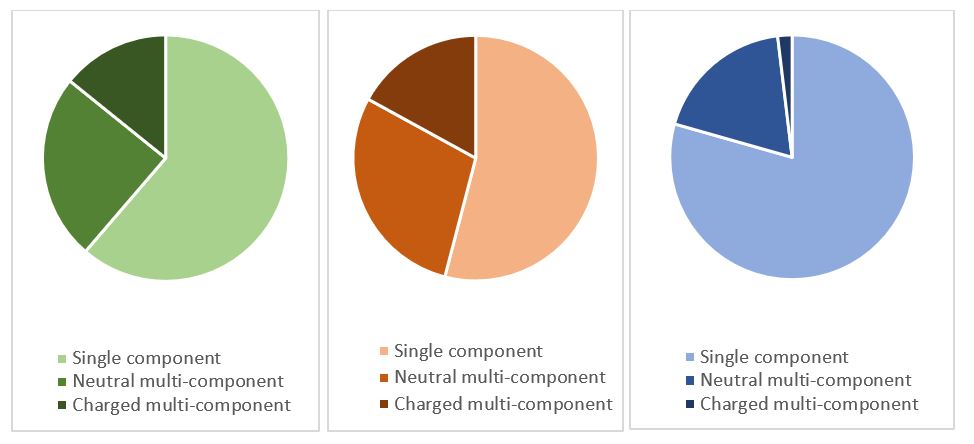
In the previous analyses I’ve looked specifically at the heaviest component of a crystal structure, thereby excluding any additional solvent present in the structure. However insights may also be obtained from investigation into any accompanying molecules. These results are perhaps somewhat less directly applicable than the previous statistics, as the crystal structure for a particular compound is not necessarily what is used for any commercial drug formulation, but certain trends can be seen. A simple count of the components in the crystal structures shows that although the organic and bioactive subsets have relatively similar distributions, the DrugBank structures are less likely to contain more than one component, and also much less likely to be salts.
Figure 4: Charts showing the proportion of crystal structures that are single component or neutral- or charged-multicomponent. As before green shows the organic subset, orange the bioactive subset and blue the organic subset.
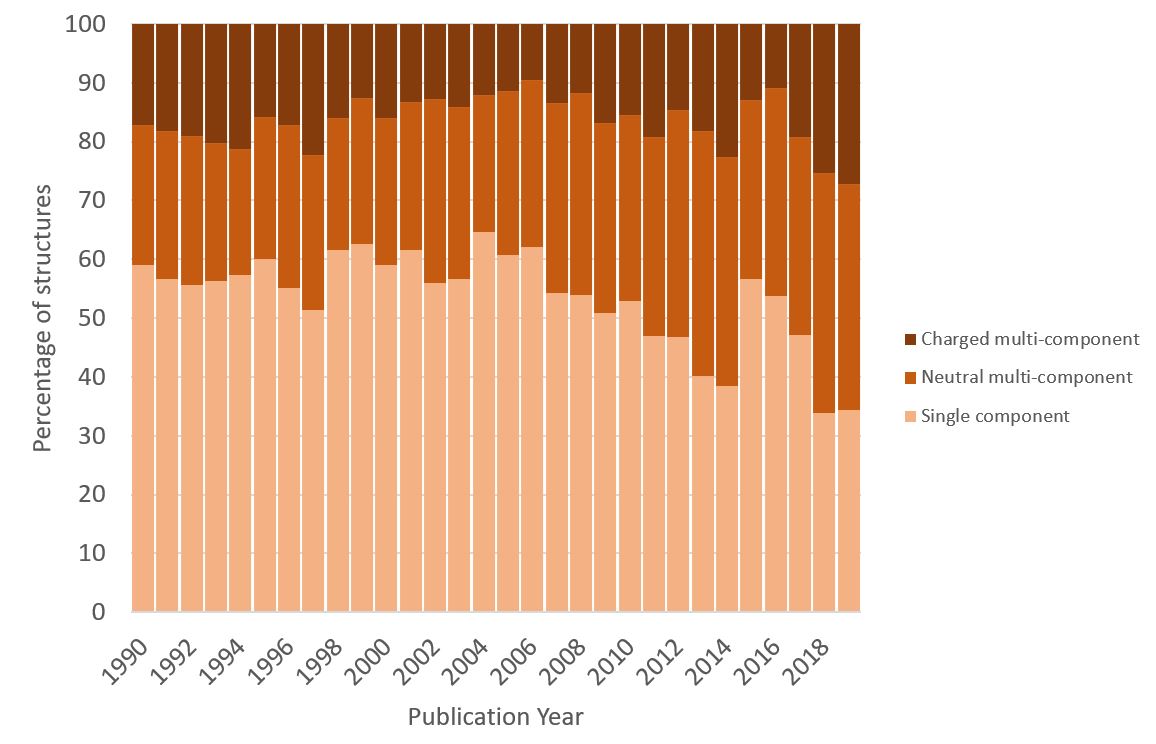
From these findings it’s also possible to further interrogate the data for additional insights. For example, from the pie chart above it can be seen that in total just over half of the structures of bioactive molecules in the CSD consist of a single molecular component. The chart below splits this data by the year in which the structure was published in the literature, and it can be seen that this overall picture does not give the whole story. Looking over the past thirty years suggests that there is a trend towards more multi-component structures. This could perhaps indicate a greater emphasis on crystal engineering within the pharmaceutical industry, exploring a greater range of crystalline forms in order to obtain desirable physical properties for their compound of interest.
Figure 5: Chart showing the proportion of structures per year from CSD entries with bioactivity that are single component or neutral- or charged-multicomponent. Colours are as per Figure 4.
It’s also possible to investigate this further by looking at the SMILES strings of the crystal structure components. From these strings the identity of the solvent molecules can also be studied. Comparing just the organic and bioactive subsets – which are broadly similar in terms of the proportion of structures containing solvent molecules – shows a clear difference in the types of solvent used. The chlorinated solvents dichloromethane and chloroform, which are commonly observed in the crystal structures of organic molecules, are not seen as common solvents for the bioactive subset.
Table 1: Top five most common solvent molecules for organic and bioactive organic molecules in the CSD
| Organic Subset | Bioactive subset | |
| 1 | Water | Water |
| 2 | Methanol | Methanol |
| 3 | Chloroform | Ethanol |
| 4 | Dichloromethane | Acetone |
| 5 | Acetonitrile | Acetonitrile |
As the CSD has passed the milestone of 1 million structures, it is perhaps tempting to view the achievement as a feat of collecting a vast number of individual datasets. Hopefully the examples shown in this blog help to demonstrate that this large volume of data from diverse sources has a great deal of value as a whole, enabling insights to be gained that can help to guide research going forward.
Over the coming months we’ll use statistics from the CSD to explore further areas of research interest and showcase the benefits of collecting these contributions from the scientific community into a single resource. We would love to hear about the insights you have gained by using the CSD too! To find out more about the CSD sign up to our regular news emails or follow us on Twitter, Facebook and LinkedIn.
Tags
