Using the Hydrogen Bond Propensity (HBP) tool to identify polymorphs
The existence of various molecular arrangements that occur in the solid-state is called polymorphism. Identifying polymorphs is important for risk management purposes and exploring the polymorphic landscape to identify the most stable forms is an important step during early-stage drug development. As part of our Tools in Action blog series highlighting the use of CCDC tools by scientists around the world, we recently showed how a research team used the Cambridge Structural Database (CSD) and the Hydrogen Bond Propensity (HBP) tool to characterize two polymorphs of an anti-inflammatory drug and predict the existence of additional forms. Here we present more information about how the HBP tool works to see if you can use it to assess polymorphs.
How does the HBP tool help identify polymorphs?
In the example we looked at, the authors used the HBP tool to identify polymorphs of Flunixin, a nonsteroidal anti-inflammatory drug (NSAID). The tool identifies possible hydrogen bond networks that can contribute to observed polymorphs – producing three key outputs:
- The Hydrogen Bond Chart – with more likely H-bond networks appearing towards the lower right-hand corner of the chart.
- The Hydrogen Bond Propensity Score Table – with higher propensity scores indicating more likely H-bond networks.
- The Hydrogen Bond Coordination Table – with more stable structures showing as many groups coordinating optimally as possible on the coordination table.
Use the H-Bond Chart and Tables together to identify good polymorph candidates to potentially observe in the lab.
The Hydrogen Bond Chart
The HBP chart shows Mean H-bond Propensity vs. Mean H-Bond Coordination. The closer the structure appears to the lower-right corner, the more likely the H-bond network. Structures appearing there may make good candidates for polymorphs.
The HBP chart for Funixin is presented in the figure below. (ref)
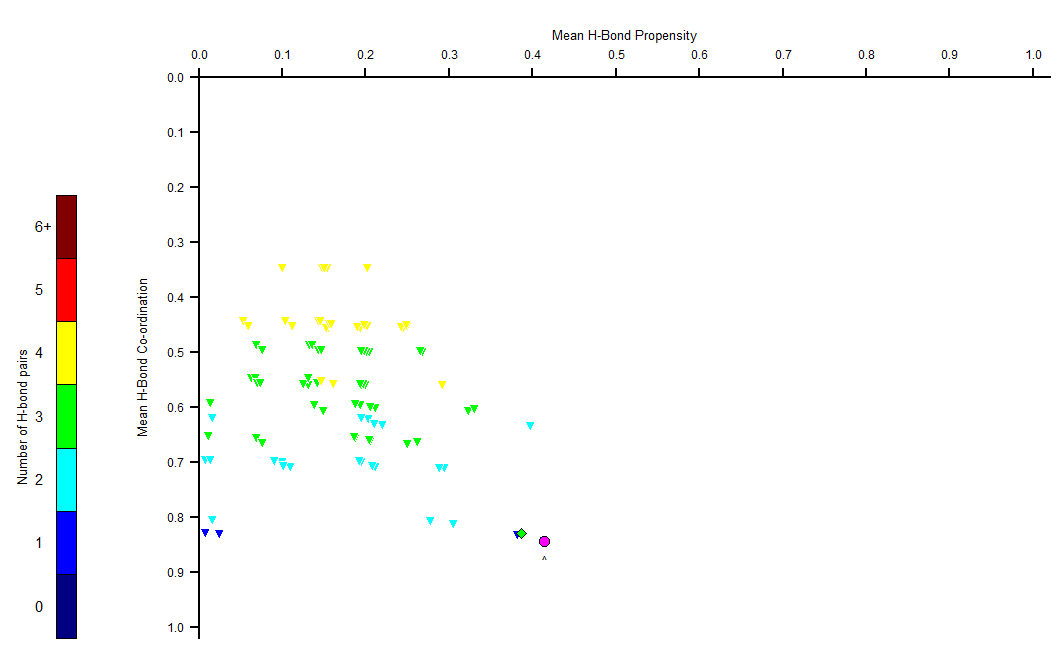
The magenta circle in the HBP chart represents Form I, and the green diamond represents Form II. The images below show the main differences between the two polymorphs’ H-bonding networks.
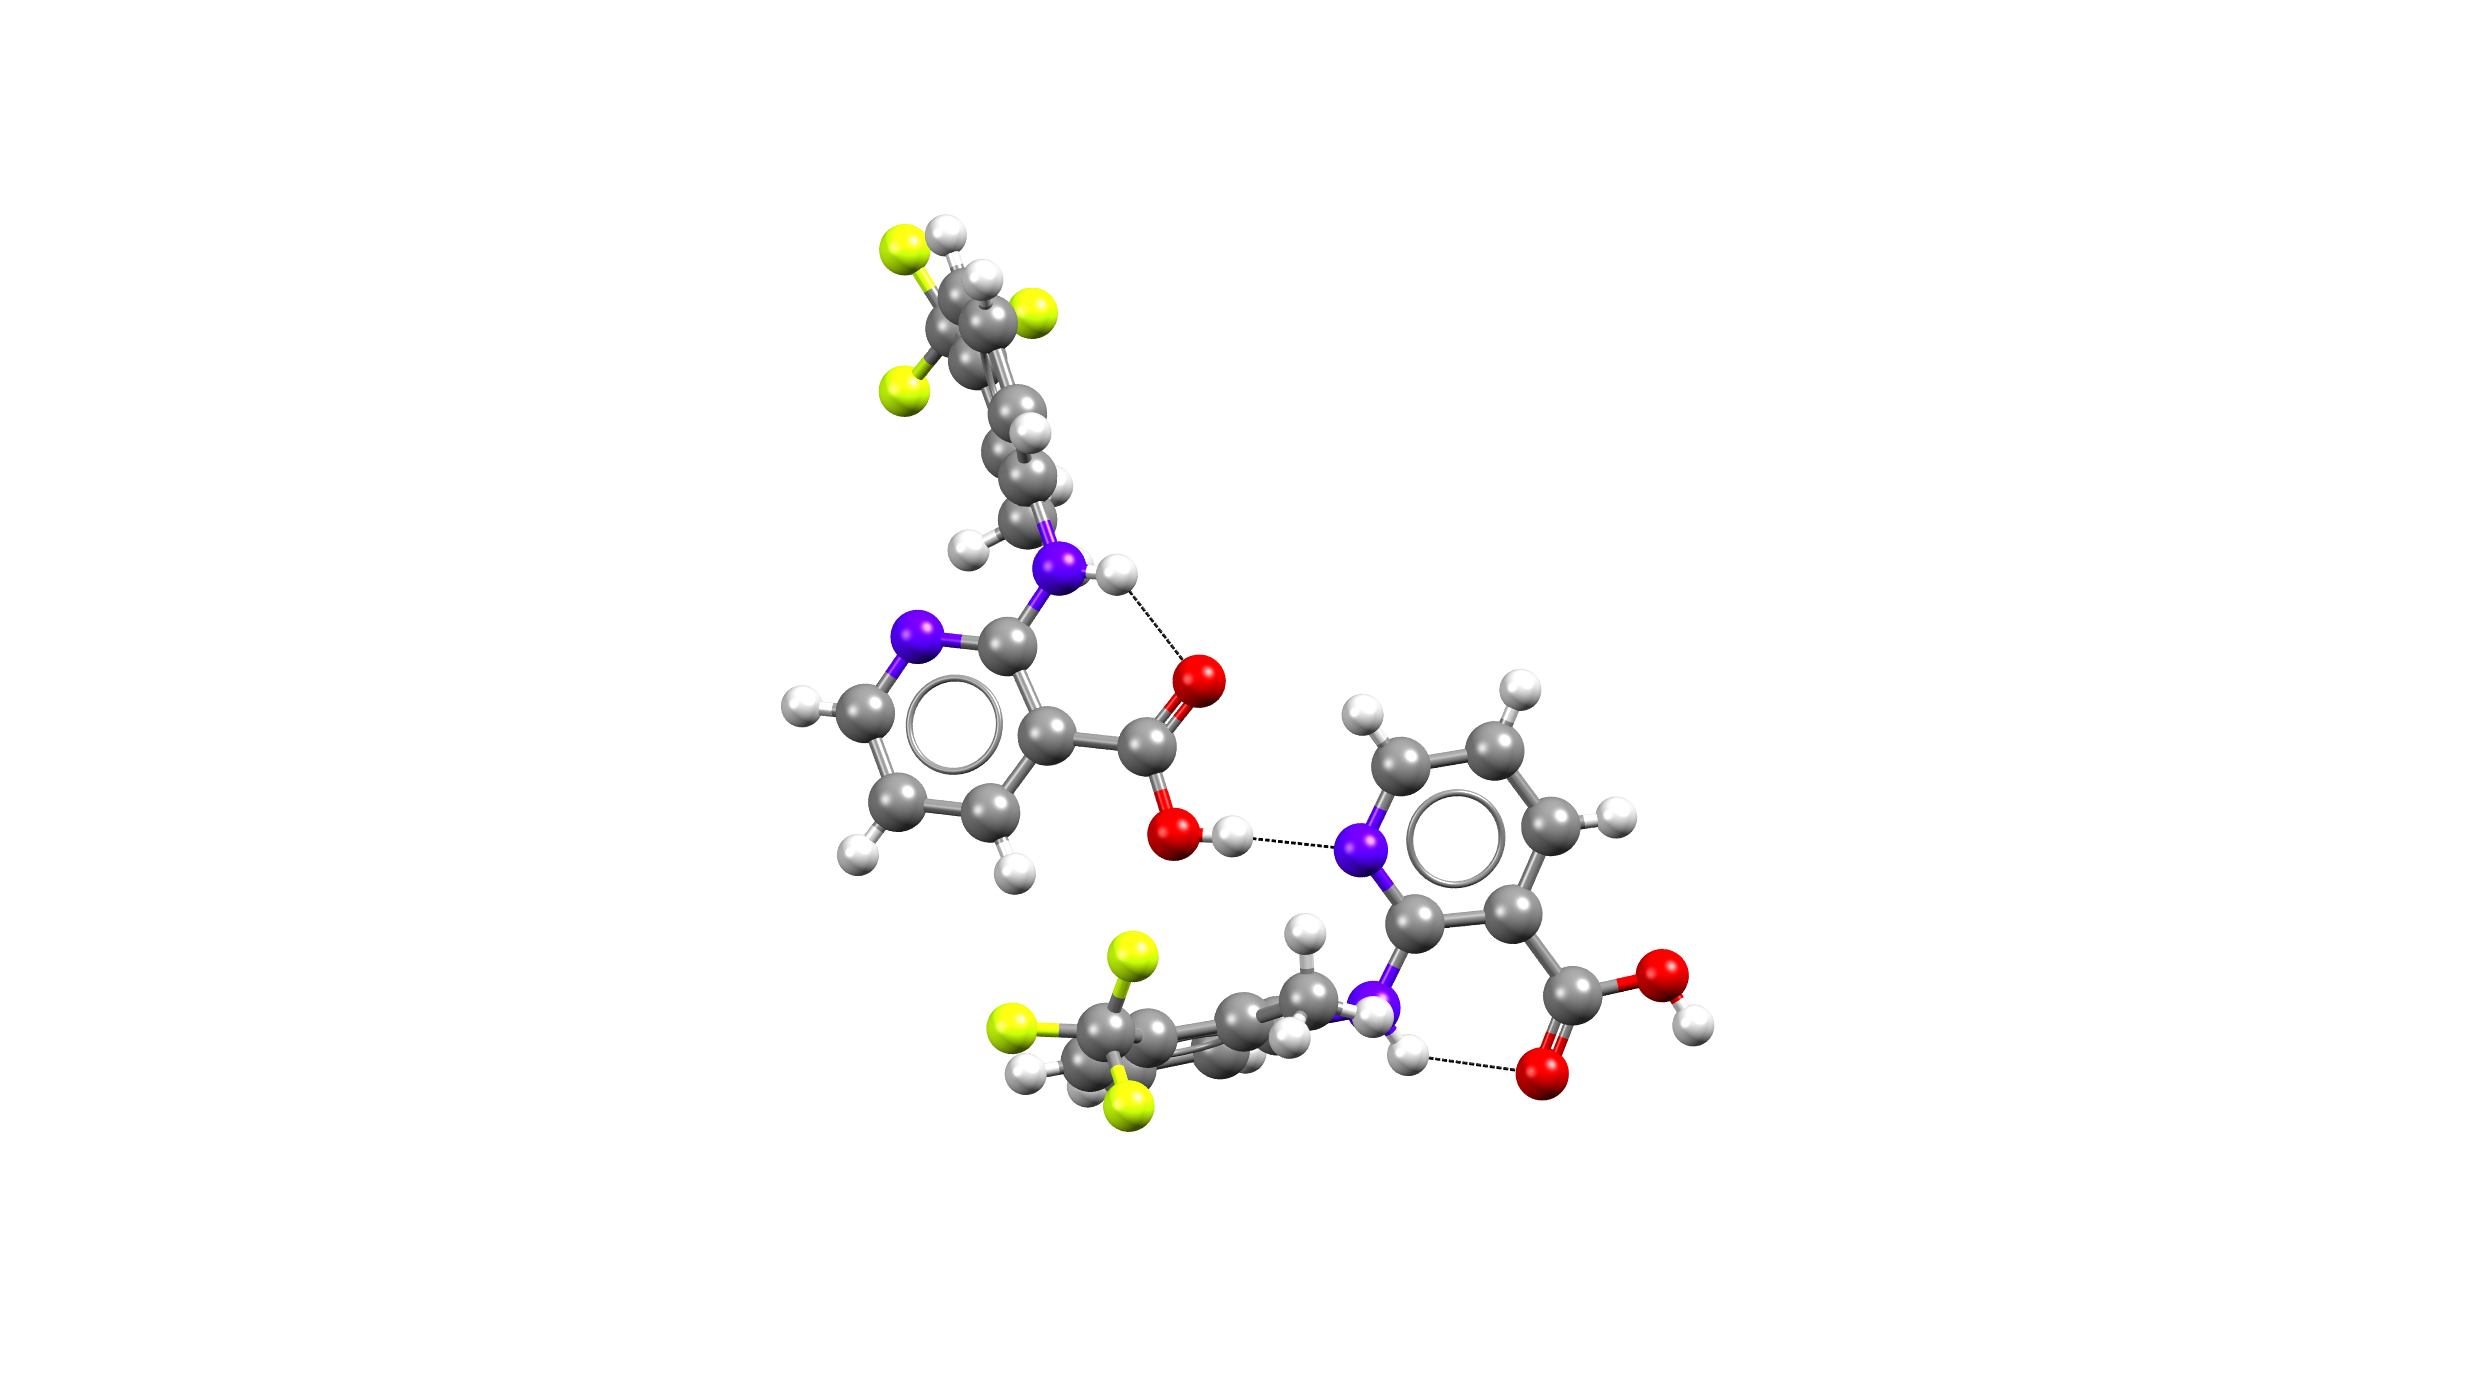
Above: Hydrogen bond network – Flunixin – Form I – acid-pyridine heterosynthon.
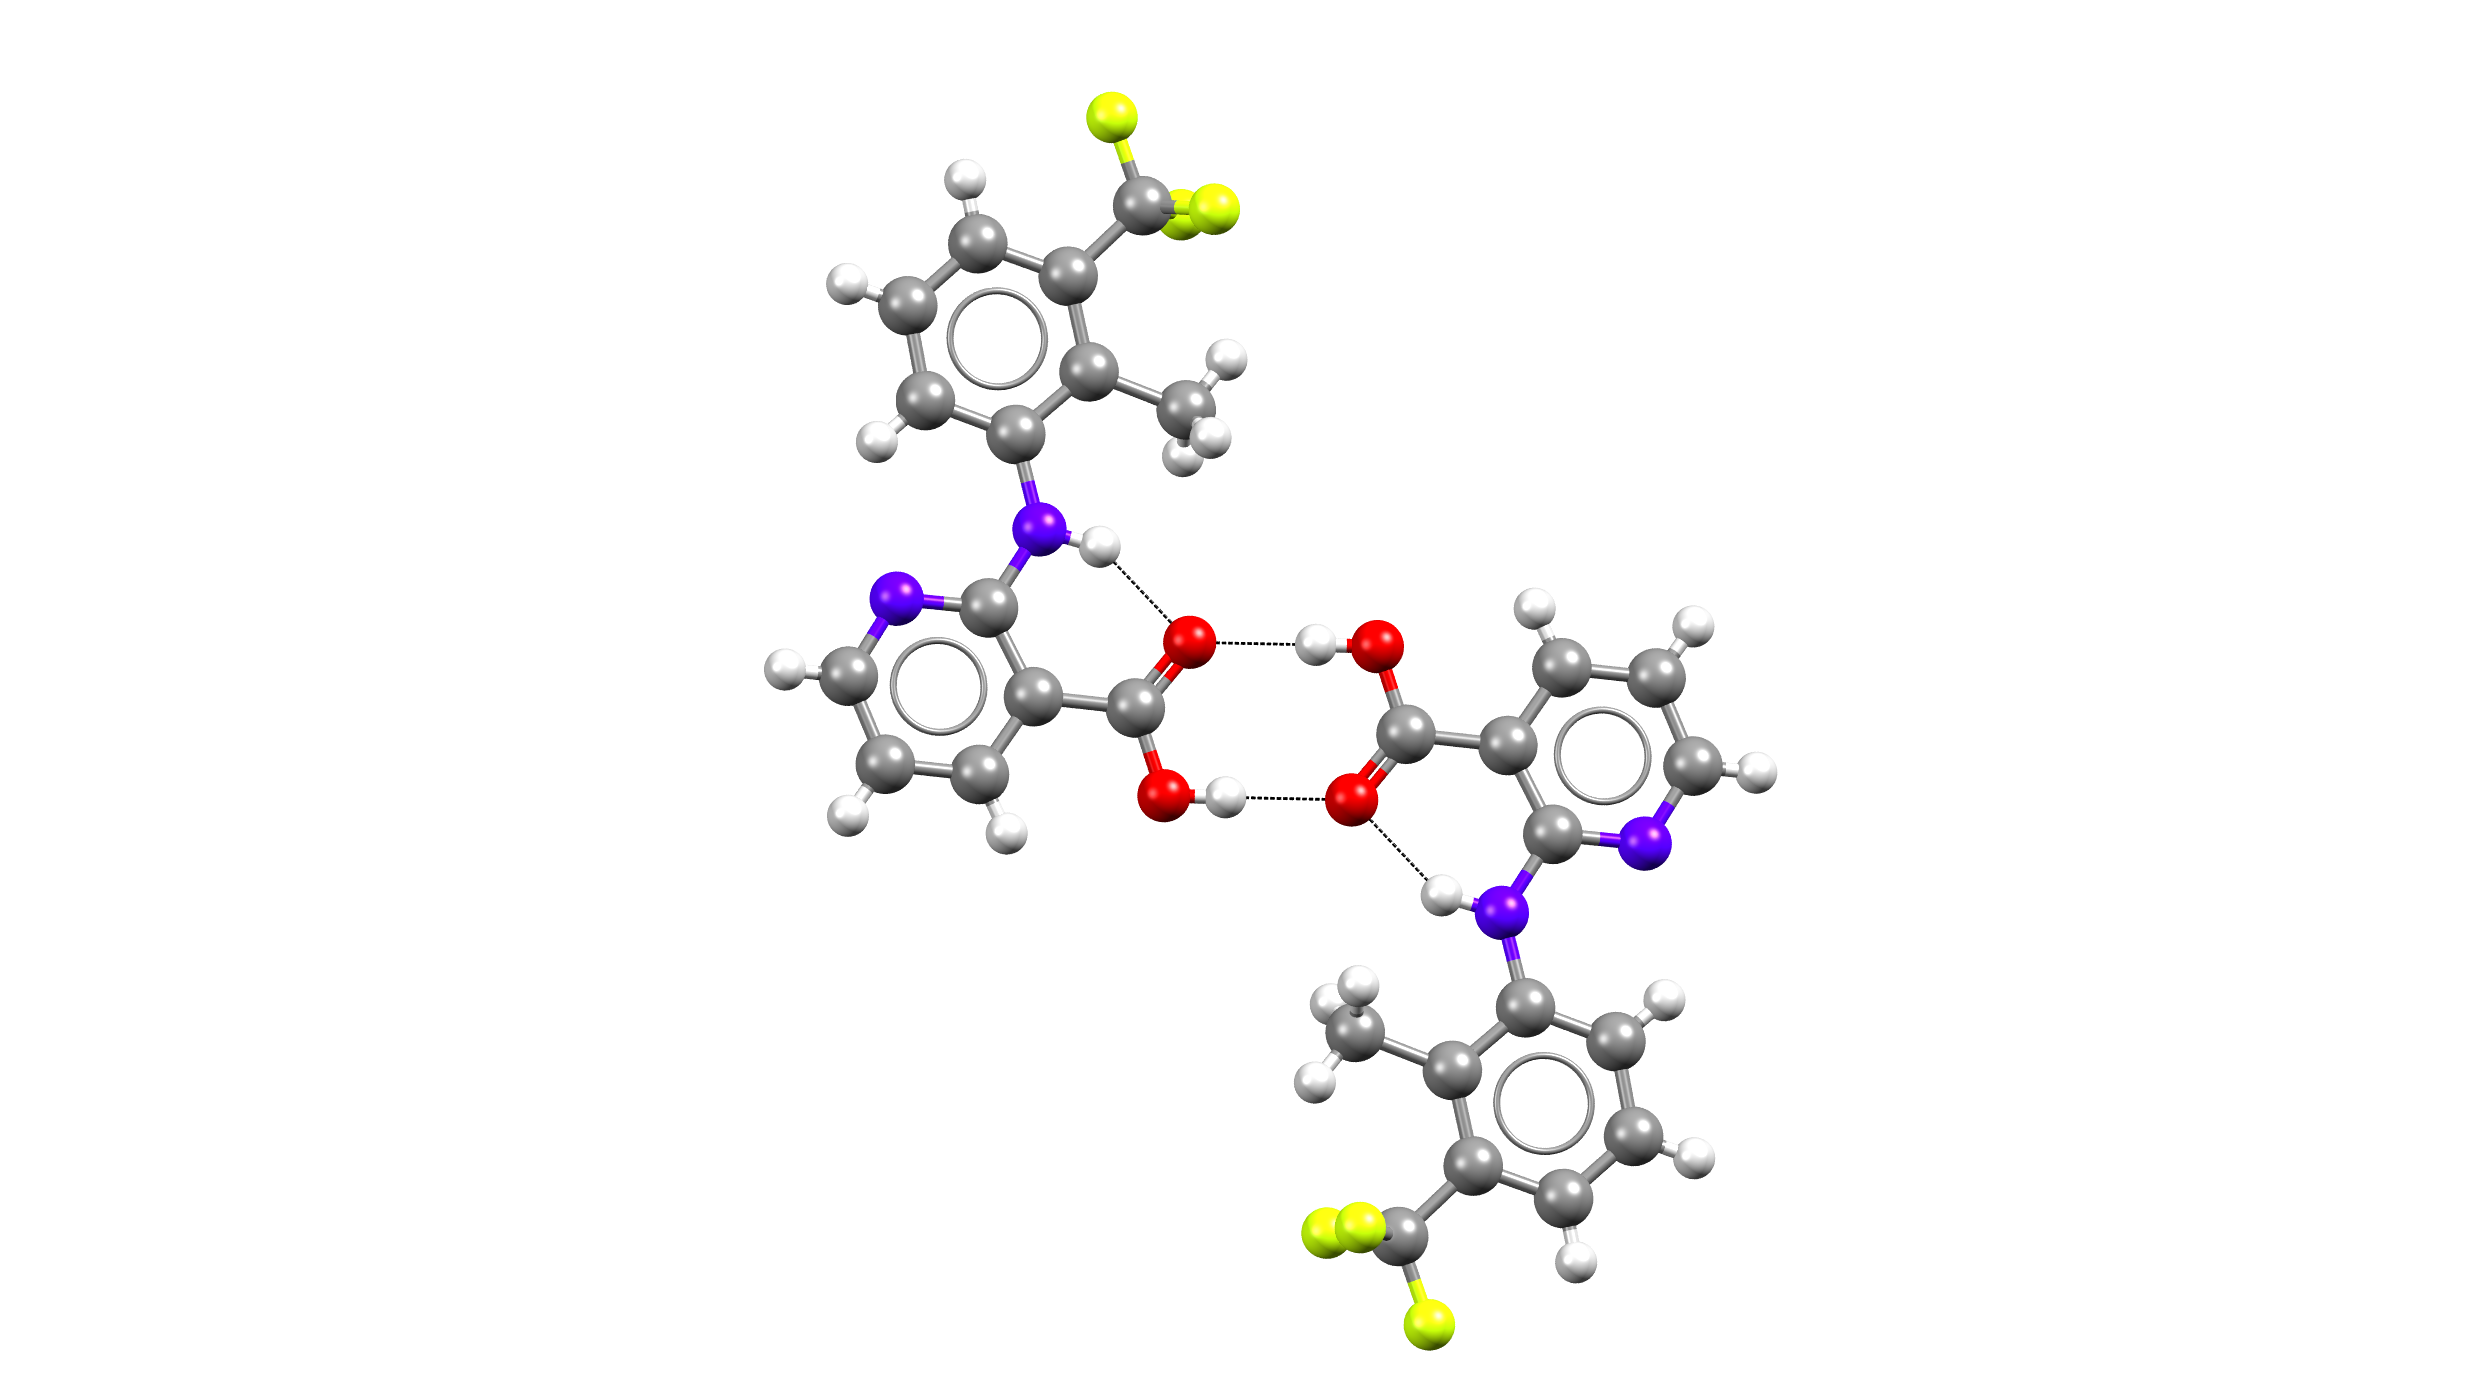
Above: Hydrogen bond network – Flunixin – Form II – acid-acid homosynthon.
The Hydrogen Bond Propensity Score Table
Another important output is the H-bond Propensity Score Table, which shows all possible H-bond interactions. The most likely H-bonding network will score the highest propensity and will therefore appear first on the table. H-bonds present in the targeted structure are marked “observed.”
The H-bond propensity score table for Flunixin was produced with CSD-Mercury and is provided below.
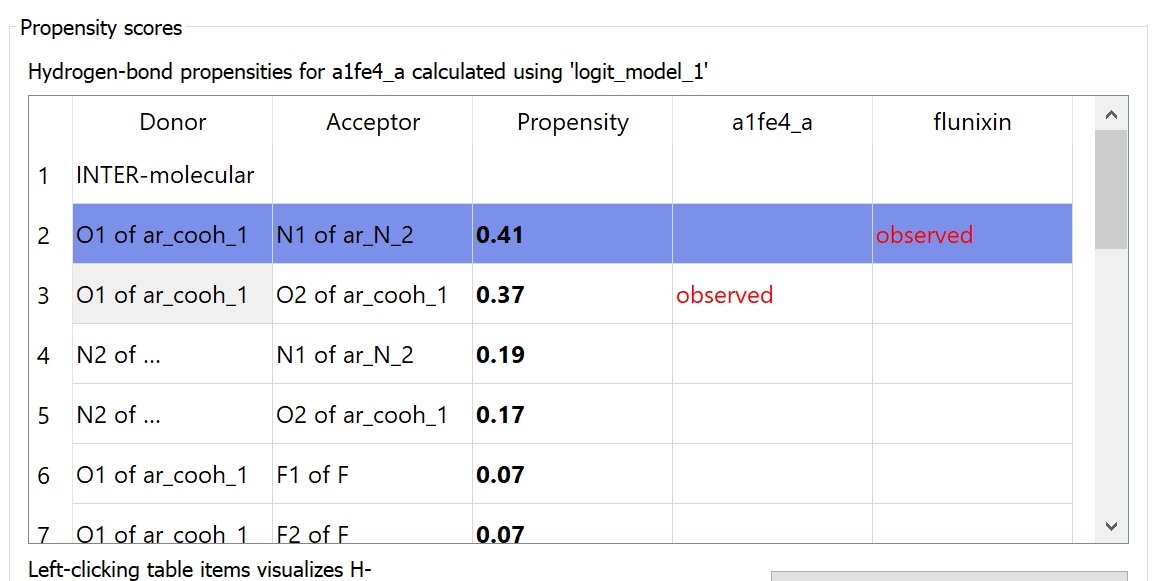
The H-bond propensity speaks to the probability that a hydrogen bond will form. Form I has a higher propensity score of 0.41, compared to Form II’s score of 0.37. In addition, Form I displays an O1…N1 interaction, while Form II forms dimer interactions utilising the carboxylic acid functional group involving O1…O2 atoms. Form I also displays a better and more often observed N-H…N interaction, while Form II displays hydrogen bonding less often, as demonstrated by the lower propensity score.
Can you use the HBP tool to identify polymorphs?
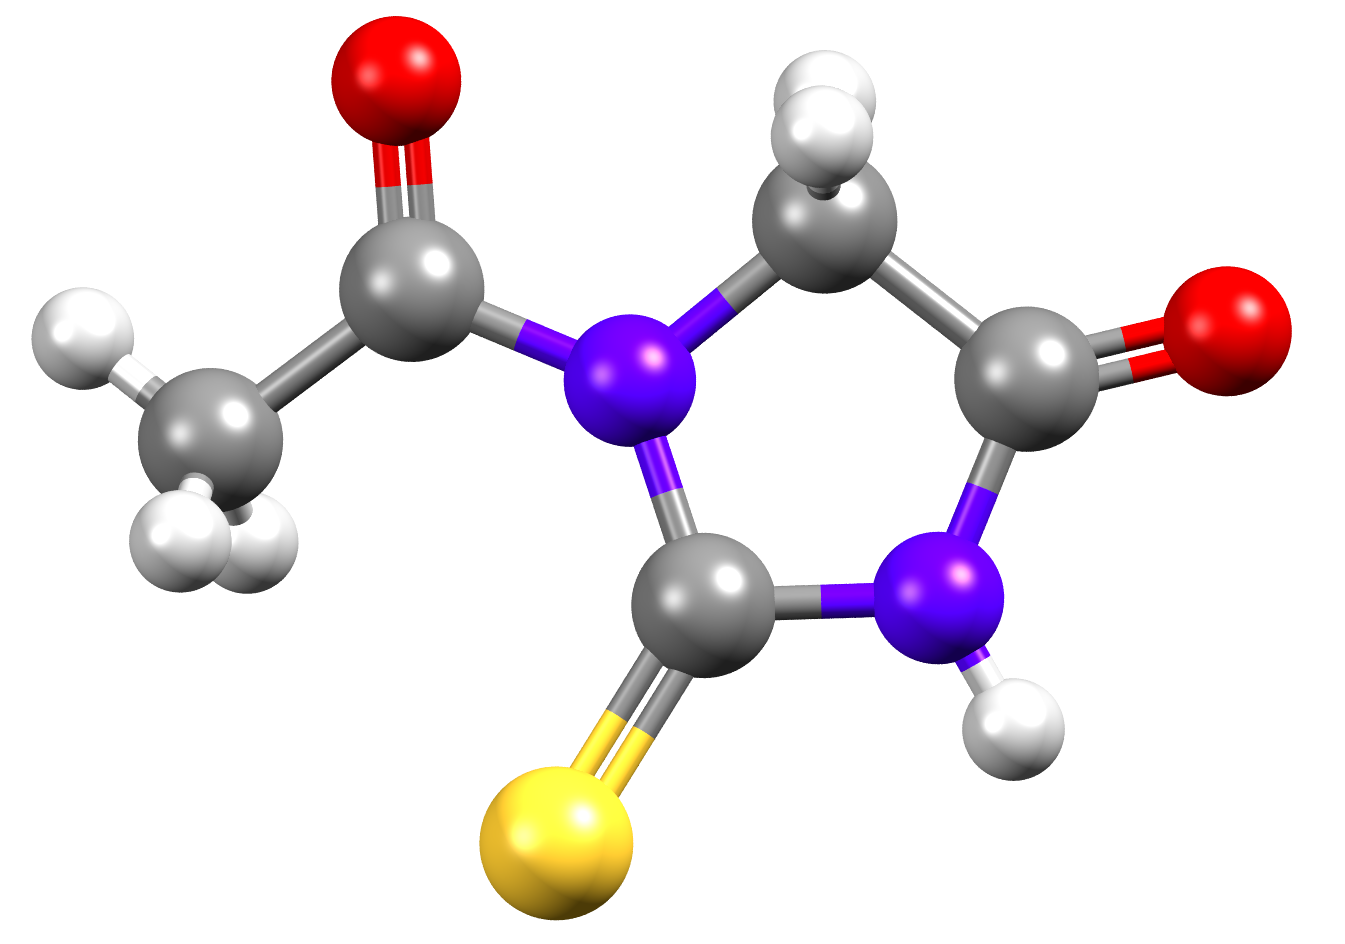
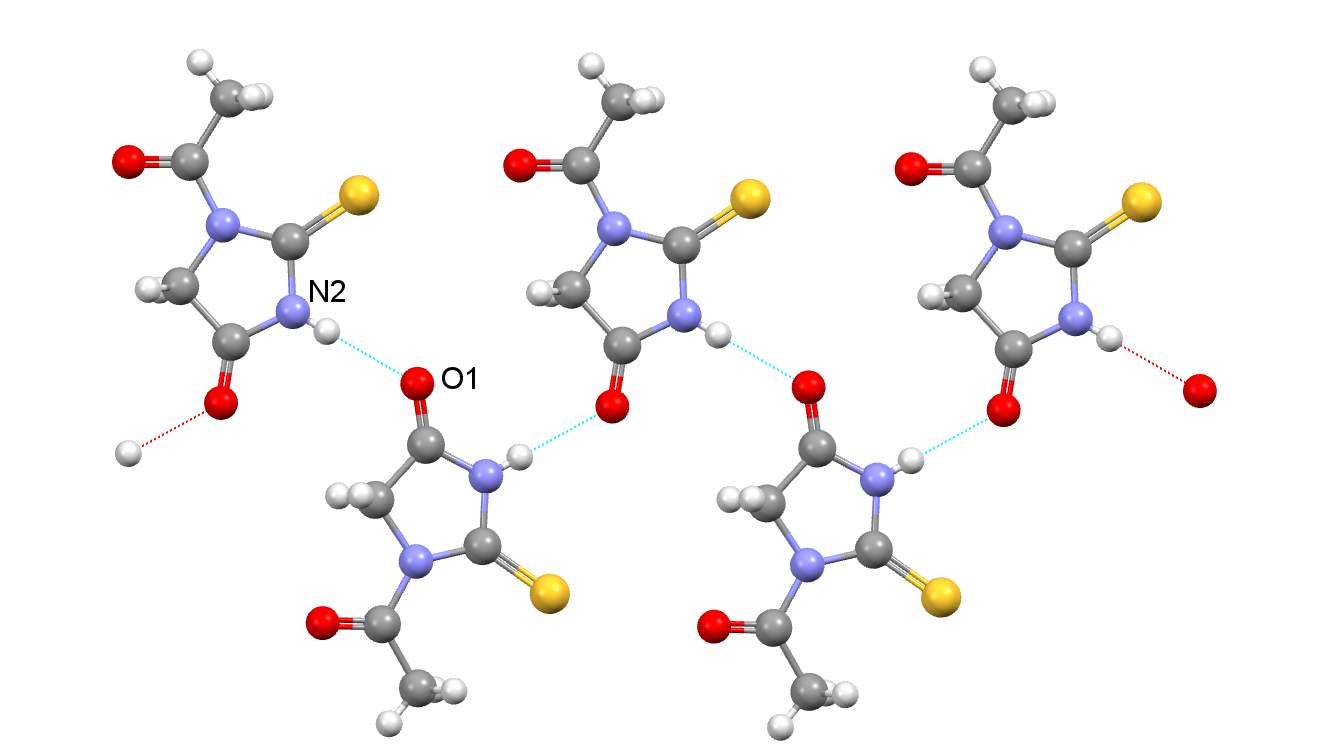
Have you tried using our HBP tool? Here is an experimental puzzle for you involving 1-Acetyl-2-thiohydantoin (NIFHIT01).
The H-Bond Propensity chart for NIFHIT01 is given below. So far, only one polymorph of NIFHIT01 is displayed.
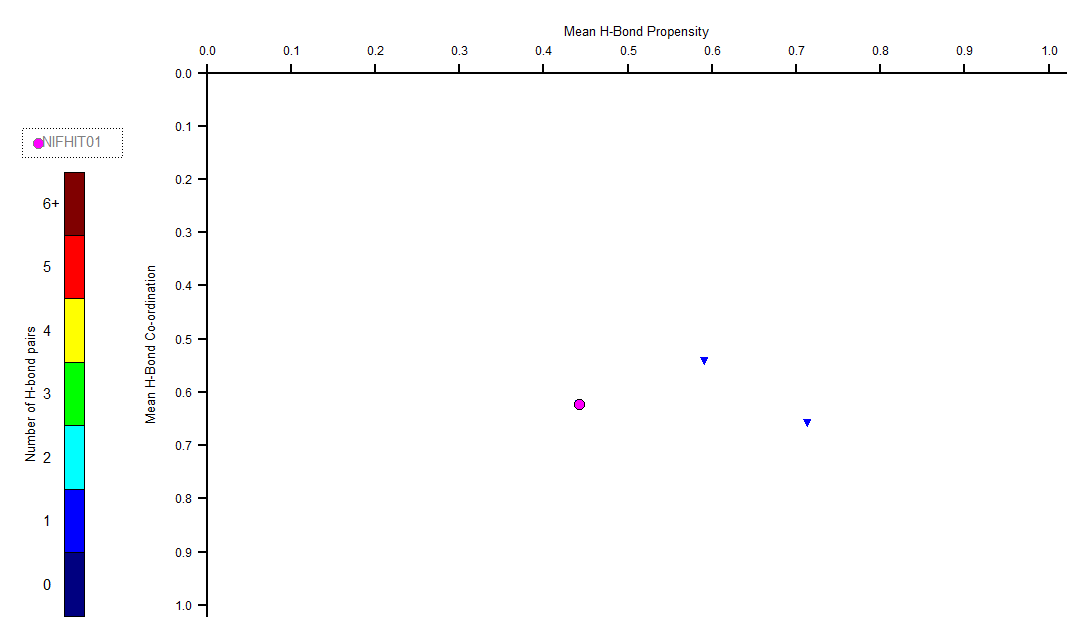
The observed structure in the chart for NIFHIT01 displays an H-bond network that involves N-H…O(carbonyl) atoms. This metastable polymorph can change into another form within a week (ref).
What other more optimal H-bond networks could that new form have? Which other functional groups could be involved in those H-Bond interactions? For a hint, check out the Hydrogen Bond Chart for CSD ref code: NIFHIT. If you find the answer, please share it with us on
Next Steps
Learn more about analysing intra- and intermolecular interactions with CSD-Materials.
Request a demo of CSD-Materials.
Read how to use the HBP tool in Mercury.
Read about CCDC’s Tools in Action.