How Torsional Data Can Inspire Drug Design
Here you will discover the importance of looking at torsional data to guide the drug design journey, and how this can be done by accessing the Cambridge Structural Database (CSD) using ConQuest.
If you are interested in finding out more about this topic, watch on demand this webinar where Gilles Ouvry of NRG Therapeutics shared how the CSD can be a source of inspiration for drug design.
Why Should You Think About Torsions in Drug Design?
One of the ways to increase the affinity of drug molecules towards their protein of interest is to ensure that their bioactive conformation – the conformation that they need to present to interact with their target of interest – is highly populated in the conformational ensemble. For this to happen, all of the single torsions in the molecule should be in a low energy space.
A good example of this concept is presented in this work reported in Bioorganic & Medicinal Chemistry Letters. The scientists at Bristol-Myers Squibb described the approach used to discover a series of FXIa inhibitors with improved potency.
The team was able to get a crystal structure of one of their leads in FXIa (Figure 1), and identified that the acrylamide portion was sitting in a high energy torsion space: usually, the carbonyl group in acrylamide faces the C=C group and this was not the case in their compound (Figure 1).
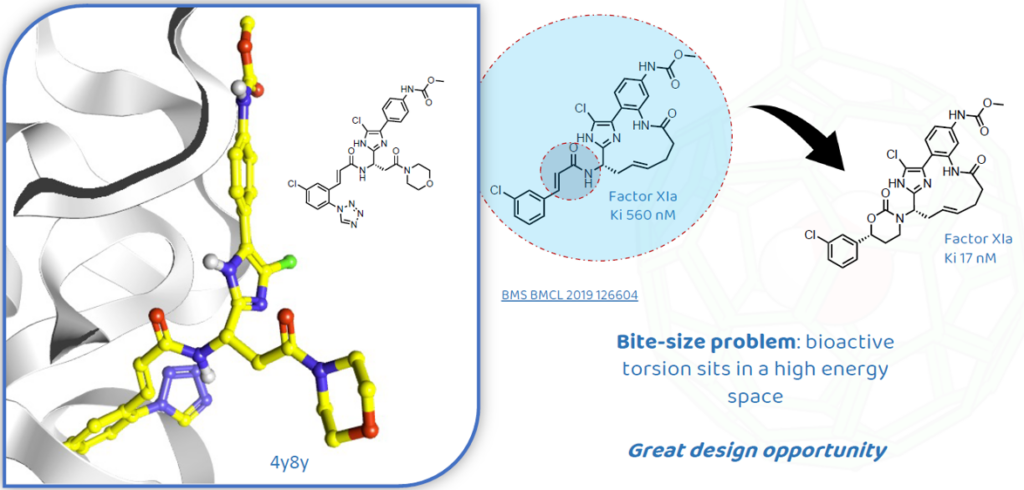
These observations represented a great opportunity for the researchers to redesign the molecule replacing the acrylamide with a cyclic carbamate and get a low energy conformation (Figure 1). The new compound showed a significant increase in potency and proved that the strategy around the conformational analysis worked well.
How Can the CSD Help?
With its over 1.25 million experimental crystal structures, the CSD is a trusted scientific resource for big-data insights. Through the use of ConQuest, you can perform targeted and precise searches of the data in the CSD, and with Mercury, further analysis of the results can be conducted to find very specific answers.
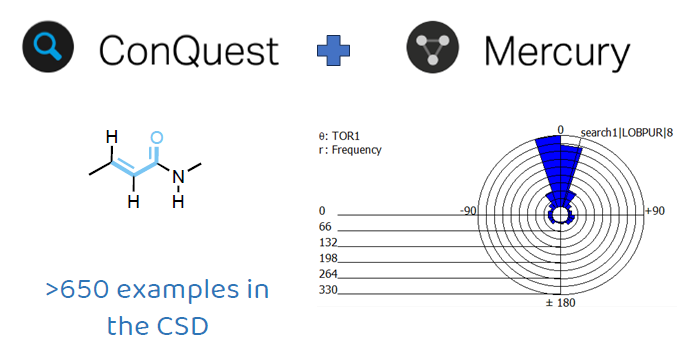
A conformational analysis search for the acrylamide fragment in the CSD, for example, shows that a cis conformation, where the carbonyl and the C=C bond form a torsion angle that is around 0°, is indeed preferred (Figure 2).
CSD-based Conformation Cheat Sheet
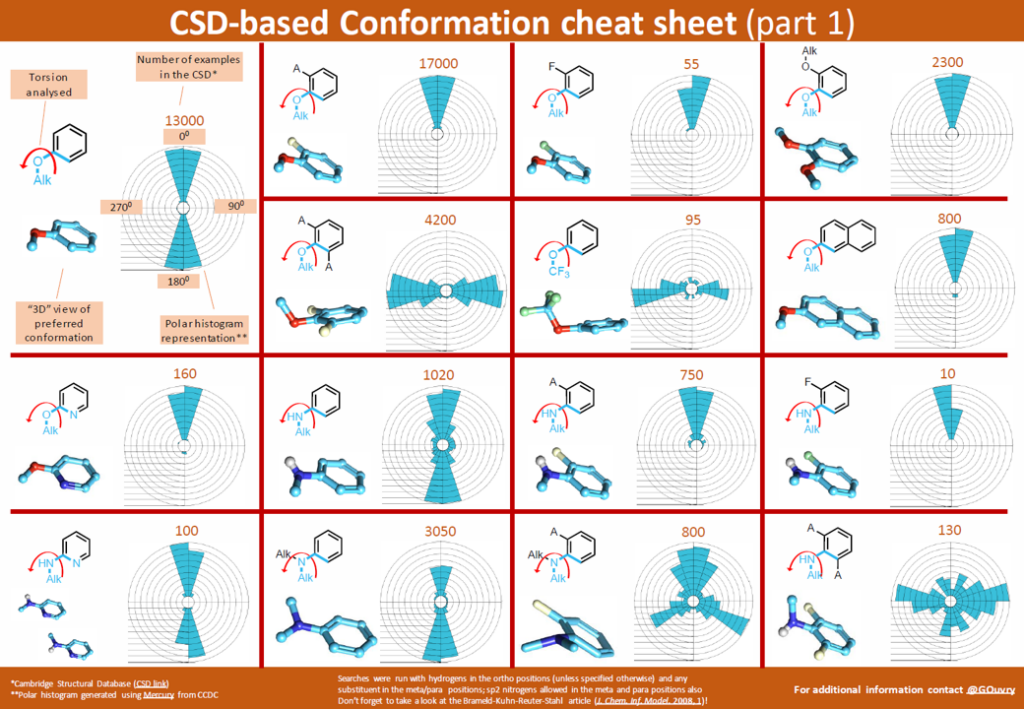
Gilles Ouvry, VP of Chemistry at NRG Therapeutics with over 21 years of experience in biotech, CRO, big pharma and mid pharma environment, is the author of the CSD-based conformation cheat sheet that can be seen in Figure 3.
During his career as a medicinal chemist, Gilles investigated a variety of torsional data included in the CSD and was inspired by it. He believes that the CSD can be a source of inspiration for drug design and hence decided to produce several of these cheat sheets involving a variety of different common functional groups used in medicinal chemistry.
“I’ve always been fascinated by conformations… I just love looking at a molecule and imagining how it might sit in 3D.”
“Remember, one of the greatest design opportunities we have as chemists is tweaking our ligands to make their bioactive conformation low in energy… and getting our torsions right is the first step in that direction (and it does not always require a computer…).” Gilles Ouvry, VP Chemistry NRG Therapeutics.
Find this conformation cheat sheet on Gilles Ouvry’s LinkedIn profile.
How To Perform a Conformational Analysis
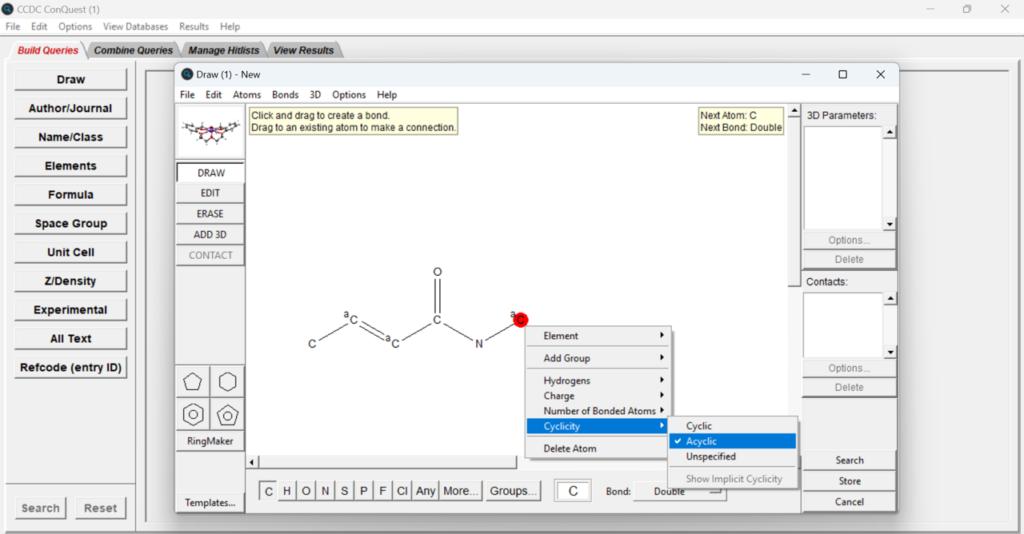
If you want to perform a conformational analysis, start by launching ConQuest, and then click “Draw” and draw the fragment you are interested in.
ConQuest is the desktop search interface to the CSD and it allows you to search for all the structures in the database that contain the drawn fragment. The data from structures in the CSD can be used to show the most likely values a particular bond, angle, torsion or ring would adopt. If you want to perform more targeted searches you can also add specific properties to each atom, such as charge, number of bonded atoms and cyclicity.
In the case in Figure 4, part of the fragment was restricted to be acyclic. Remember that adding specific properties will restrict your search but can also help focusing your analysis on conformations that are more comparable to the one you want to analyse.
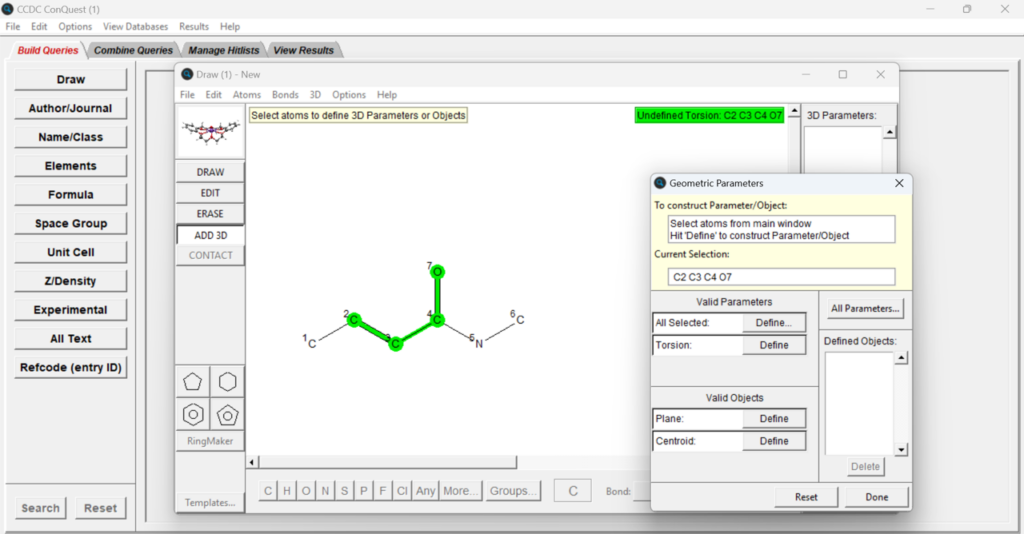
Once all the search parameters that you want are added, press “3D” on the menu on the top and then “Define Parameters”, or click on the “ADD 3D” button in the menu on the left. You can then select the four atoms that are involved in the torsion angle (make sure to select them in order) and click the “Define” button next to “Torsion” in the “Geometric Parameters” panel (Figure 5). You are now ready to press “Done”, and can define other parameters simultaneously if that is of your interest. Click “Search” to launch the “Search Setup” window and “Start Search” to begin the search.
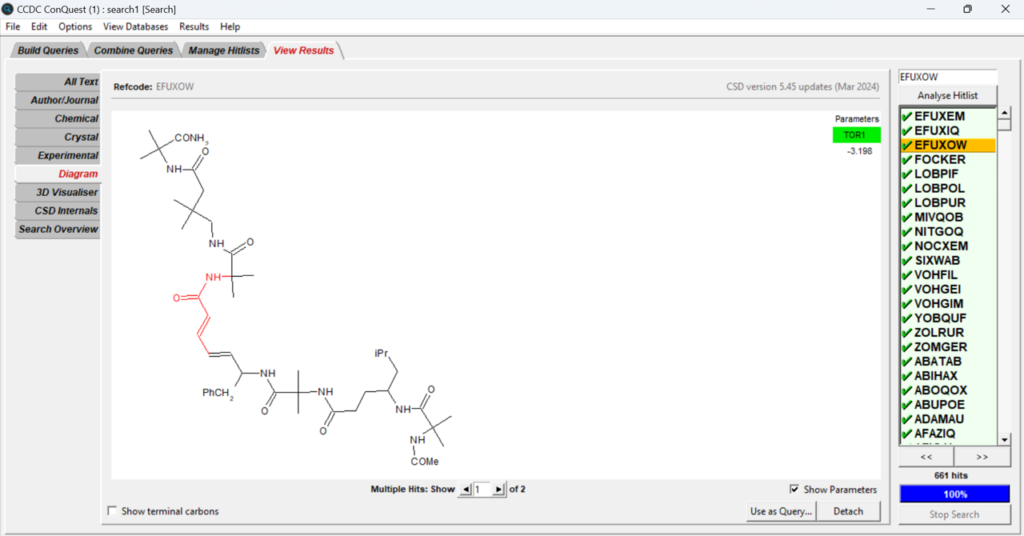
You can now look at the hits obtained from the search selecting different structures on the panel on the right seen in Figure 6, and visualize different information related to the specific structure by selecting different options from the panel on the left in Figure 6. The torsion angle values are displayed on the top right of the central panel.
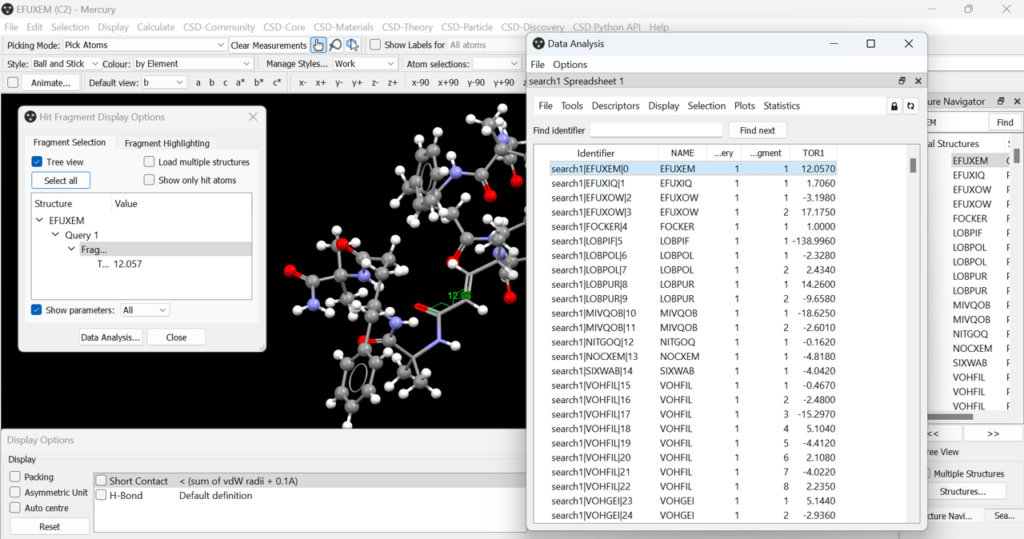
You can also visualize your structural data in Mercury. To create the polar plot seen above, you’ll have to select “File” > “Analyse Data in Mercury” > “Analyse in Mercury”. The main visualization window in Mercury will open, including a “Data Analysis” window and the “Hit Fragment Display Options” window. The first entry in the “Data Analysis” window is selected by default and displayed in the main Mercury window, and you’ll be able to see the torsion angle directly on the structure.
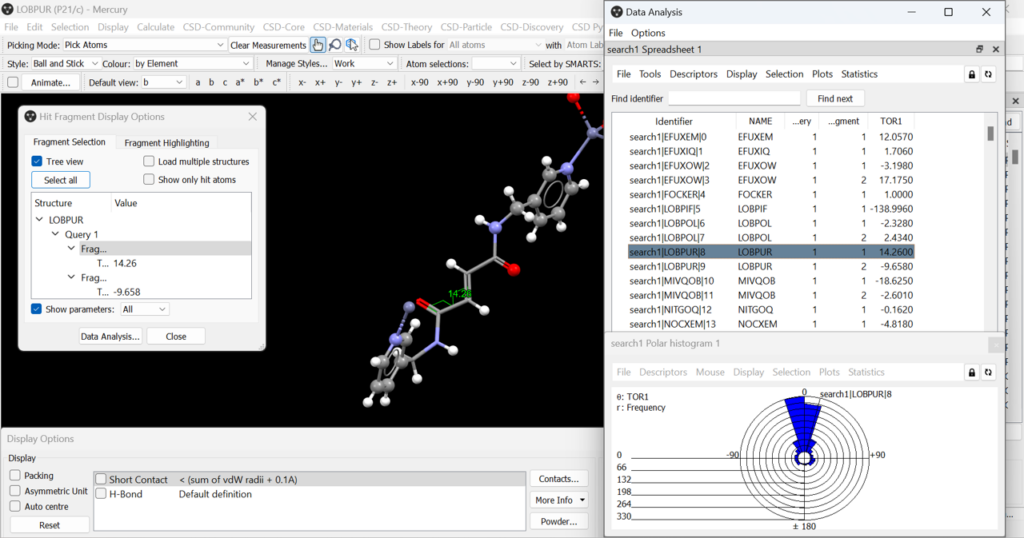
You can generate plots of the torsion angle data from the “Plots” menu in the “Data Analysis” window (Figure 7). Select “Polar histogram” and then change the descriptor for the polar histogram to the one that indicates the torsion angle data, in this case TOR1, and then press “OK”.
A histogram showing the frequency of the torsion angle values found in the CSD for the fragment drawn at the beginning of the search will then be produced. By selecting different structure identifiers in the “Data Analysis” panel you can see where that specific torsion angle value is found in the histogram and see the selected structure in the Mercury main panel (Figure 8).
Next Steps
Discover our self-guided workshops intended to guide you through the use of various tools included in the CSD-Core software suite, including ConQuest and Mercury.
To discuss further and/or request a demo with one of our scientists, please contact us via this form or .