Getting started with Full Interaction Maps
Our collection of educational resources has been growing throughout 2020, welcoming new How to videos (on our YouTube channel), new self-guided workshops and updates to our existing material. We also added a feedback survey for you to fill in at the end of each workshop to let us know how we are doing and how we can improve.
This month we include in our collections 2 new resources, both about Full Interaction Maps (FIMs, for short): an educational video and a self-guided workshop. With now 2 videos and 3 workshops on the topic, it seems the right time to write a blog about Full Interaction Maps and walking you through the available material: from learning about FIMs, to the first steps to use it, to using their potential in your research.
How do Full Interaction Maps work? How will it help me in my research?
Full Interaction Maps enables you to generate a 3D interaction map that wraps around a molecule and represents the regions of higher probability to find interactions with certain functional groups. We believe it is such a powerful tool that we made it available in Mercury with both the CSD-Materials and the CSD-Discovery licenses.
A great way to get started with FIMs is to show you how FIMs work, together with few examples that will give you an idea about insightful information that FIMs can provide on your molecules, crystal structures, and ligand interactions. Our new educational video on FIMs aims exactly at this.
Click on the image to watch the video on YouTube.
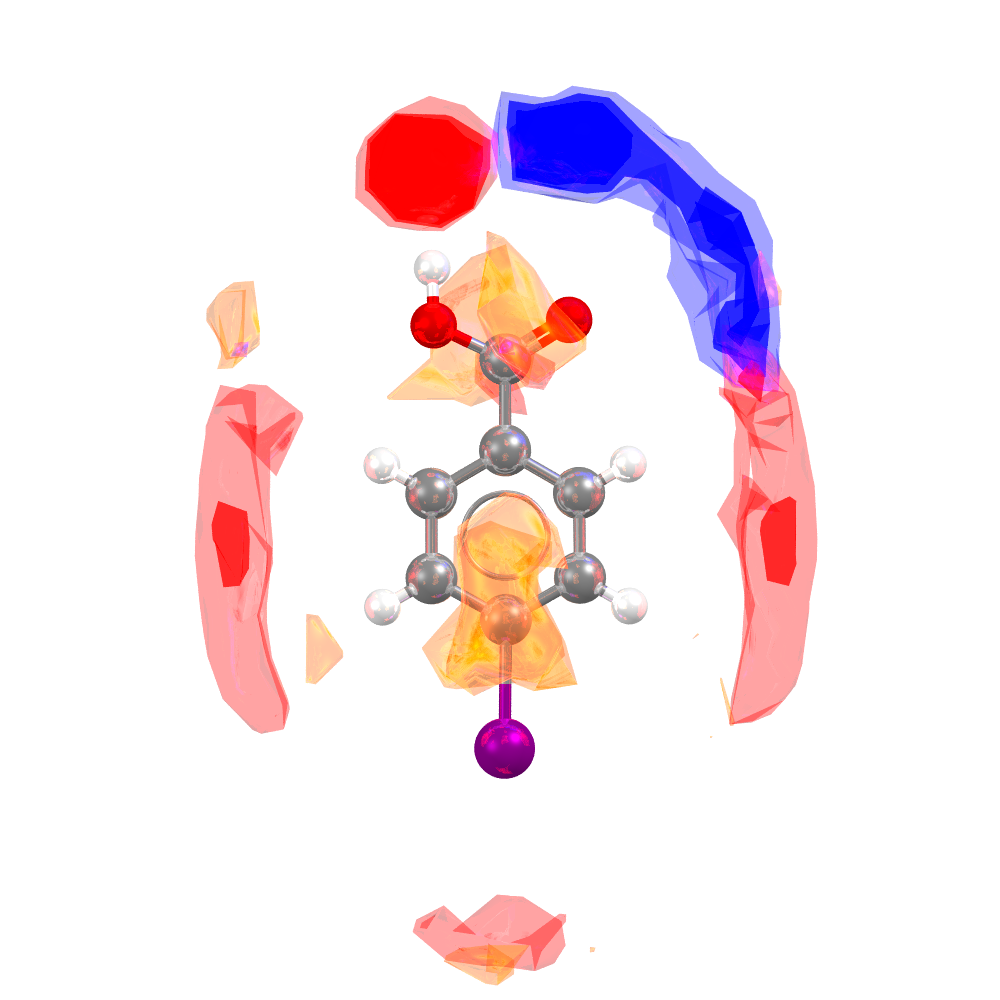
In this video we learn that the Full Interaction Maps tool takes its power from the wealth of information in the Cambridge Structural Database (CSD). The knowledge from over 1,000,000 structures is used to generate statistics about the probability (and relative position and orientation) of a series of functional groups (or probes) interacting with each other, based on how many times those interactions have been observed in the CSD. This data is then collected, elaborated, and transformed in scatterplots by IsoStar. However, FIMs goes beyond the functional group-based approach and investigates the interaction preferences of the whole molecule(s). How? FIMs breaks down the molecule in distinct functional groups and then uses the relevant interactions data found in IsoStar to generate 3D maps of molecular interaction preferences (Wood et al.,CrystEngComm, 2013, 15, 65-72). These maps are colour coded to describe the type of interaction expected (e.g., blue shows where potential hydrogen bonds donors would be located, red acceptors and orange for aromatic interactions). Note that several different other probes are available in FIMs.

Example of FIMs for CSD Entry BENMOW07.
Building a Full Interaction Map for a molecule in your crystal structure enables you to assess whether the preferred interactions, evaluated based on the mega database knowledge, are satisfied in your structure. You can imagine that gaining such insights of your crystal could be useful in many different ways.
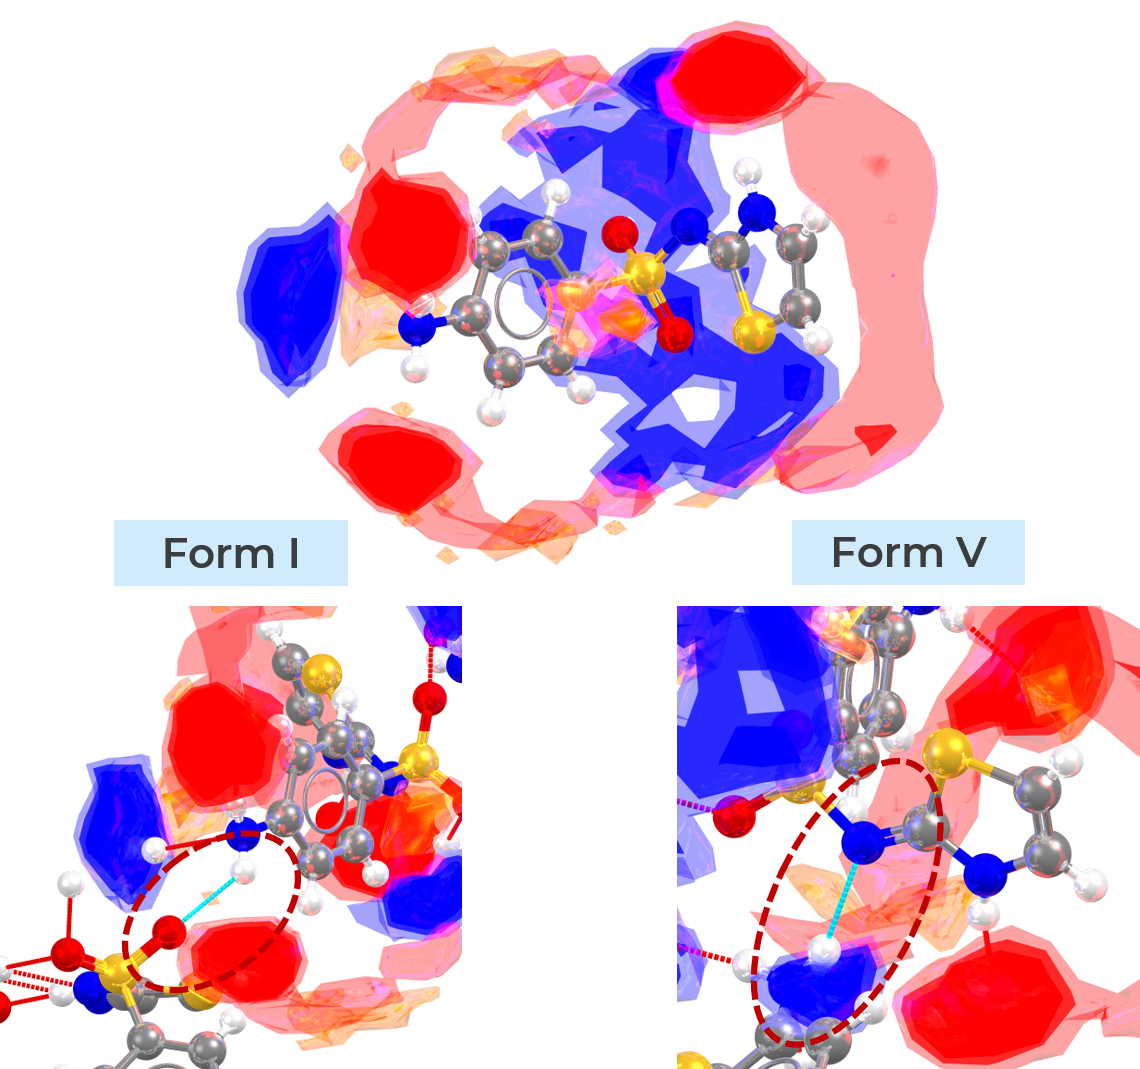
For example, the abovementioned video presents the case of sulfathiazole polymorphs. For this molecule it is known that polymorphic form V is more stable than form I. With FIMs we can rationalise such stability by looking at the interaction preferences of both polymorphs. In polymorph V the interaction preferences predicted by FIMs are fulfilled by the crystal packing, while form I presents connections outside the predicted peaks (see image below). These may be interpreted as signs of stability or metastability, respectively.
If you want to know more, the video presents other examples from three explicative areas of application: study of polymorphs and structure stability, co-crystallisation and solvate formation, highlighting also how FIMs can fit in the solid form screening workflow.

Example of interaction not corresponding to FIMs prediction for sulfathiazole form I (metastable, on the left-hand side) and of satisfied interaction instead for form V (stable, on the right-hand side).
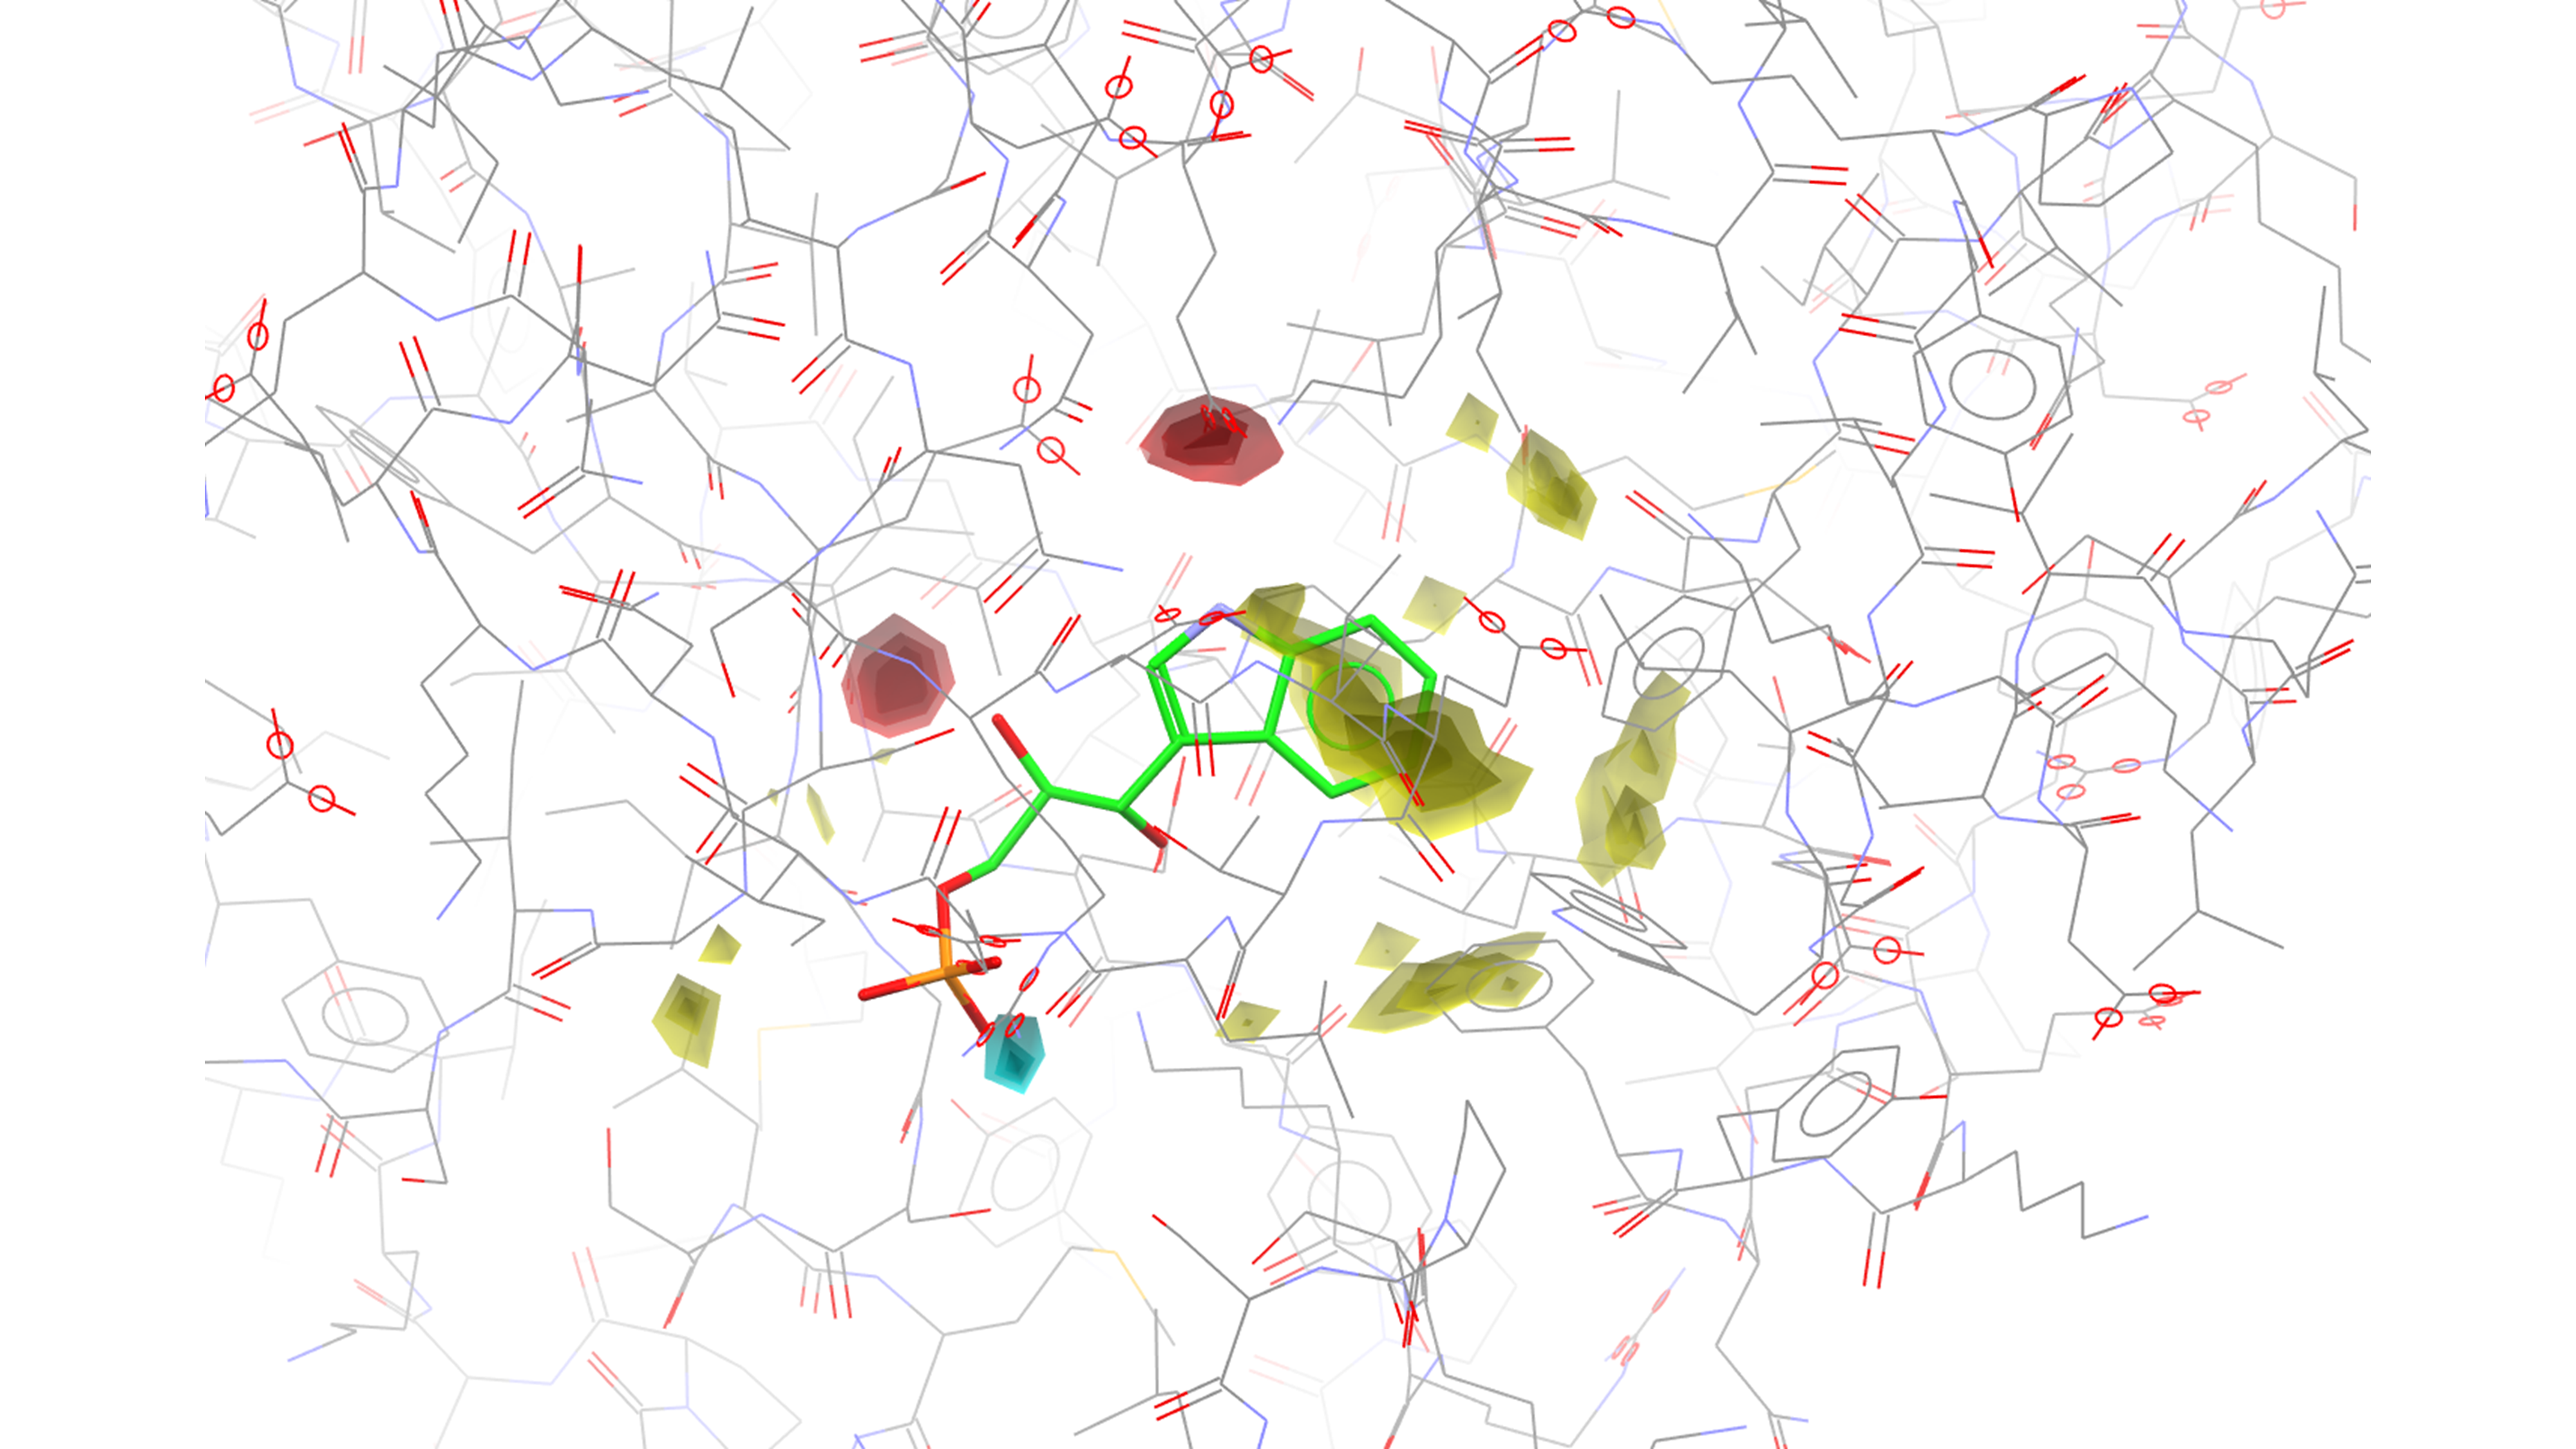
Additional applications of FIMs can be found in discovery science, for example in understanding the protein-ligand interaction from the ligand perspective. Our new workshop (Understand protein-ligand interaction patterns using Full Interaction Maps, MER-004) will guide you through the process of generating and interpreting FIMs data in the protein-ligand context. In the example, we use FIMs to analyse the best docking solution and to evaluate if the key interactions that a ligand can form are satisfied by the protein. Such analysis helps to rationalise activity as well as to suggest ligand modifications.
This workshop, moreover, suggests how FIMs can be part of a larger workflow with GOLD, to generate the docking solutions, and with SuperStar, to have a thorough understanding of the protein-ligand interactions. Indeed, GOLD can be used beforehand to assess and identify docking solutions. Then, while FIMs investigates whether the actual interactions satisfy the expected ones for the small molecule (i.e., the ligand), SuperStar performs a similar analysis but this time from the protein point of view. Therefore, FIMs and SuperStar complement each other providing a full picture of the protein-ligand interaction preferences.

Example of Full Interaction Maps in the context of protein-ligand interactions study, visualised in Hermes.
How to generate full interaction maps
Generating FIMs is very easy. If this were one of our #CSDTopTipTuesday posts (weekly tips on the CSD-Portfolio on our social media channels) it would be more or less like this:
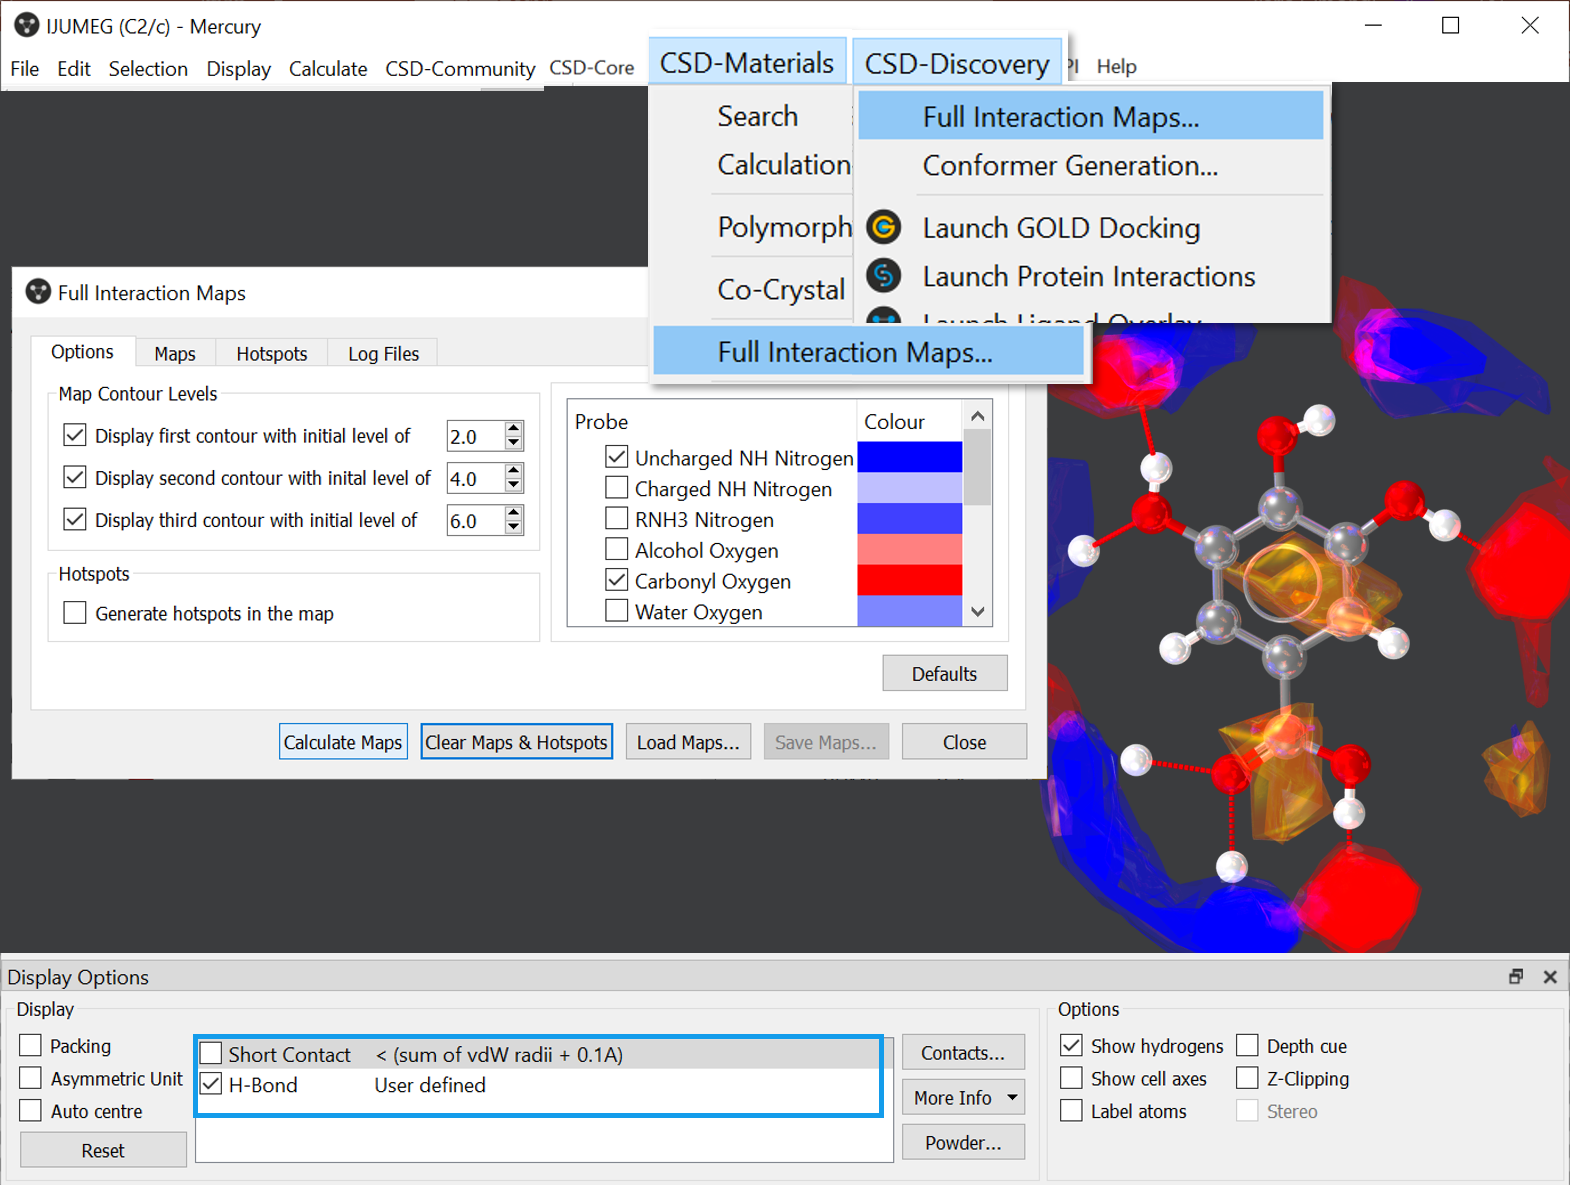
Visualise Full Interaction Maps in Mercury! Go to CSD-Materials > Full Interaction Maps and in the pop-up click Calculate Map. Note that Full Interaction Maps is available also from the CSD-Discovery menu. #CSDTopTipTuesday shown on CSD Entry IJUMEG.

How to generate FIMs in Mercury for CSD Entry IJUMEG.
We hope that our training resources will guide you in your journey discovering and learning FIMs: from how to generate full interaction maps, including the options available, to analysing the results, covering colour code, interactions visualisation and complementing the analysis with other CSD tools.
You can refer to the following resources:
- How-to video (YouTube): a step-by-step guide that you can follow along, covering the basics to calculate FIMs and evaluate whether the interactions in your crystal fulfil such predictions.
- Full Interaction Maps self-guided workshop (MER-002): step-by-step exercises based on examples applications. This workshop allows you to try yourself the analysis for the sulfathiazole polymorphs presented in the educational video, as well as study a series of halogenated molecules, also included in the mentioned video as a clear representation of the power of FIMs, and an additional example of co-crystallisation analysis.
- Understand protein-ligand interaction patterns using Full Interaction Maps (MER-004): the new workshop presents how to interpret FIMs in the context of protein ligand interactions (see above) and guides you step-by-step in the analysis of FIMs using Hermes. If you don’t have a CSD-Discovery or CSD-Enterprise license, don’t skip this workshop just yet: it also shows how to save FIMs in a working directory!
- Bonus – Polymorph Risk Assessment self-guided workshop (MAT-001): while most of this workshop focuses on Hydrogen Bond Propensity (HBP, another powerful tool available from the CSD-Materials suite), a section of it presents how FIMs, HBP and Mogul geometry check can complement each other in the study of polymorphism.
Additional resources
For more information, you can read the associated publication covering more in details on the methodology (Wood et al.,CrystEngComm, 2013, 15, 65-72), visit the FIMs dedicated webpage, or check section 21.9 of the Mercury user guide.
I hope you will find our videos and self-guided workshops helpful in supporting your use of FIMs in your work and research.