A year of data at the CCDC
We started 2020 with a lot of excitement and expectations. After all, we had just achieved a major milestone with the millionth structure in our database, and an additional 60K entries by the end of 2019. We were all geared up with new strategies and plans to tackle the data that would start pouring in in 2020. And yes, we did have a lovely busy start. Little did we know 2020 had plans which none of us could have fathomed. By early March it was "crystal" clear that 2020 had made up its mind to make things difficult for all of us!
With lockdowns, closure of offices and labs, many of us had come to terms to working from home, our ‘new normal’. Due to all the disruptions, confusions and lockdowns around the world, we realised the need to analyse how this pandemic is affecting us at CCDC. More specifically, how its effecting:
- The data that we receive from around the world.
- How efficiently we are able to deal with this data, given all the change in circumstances.
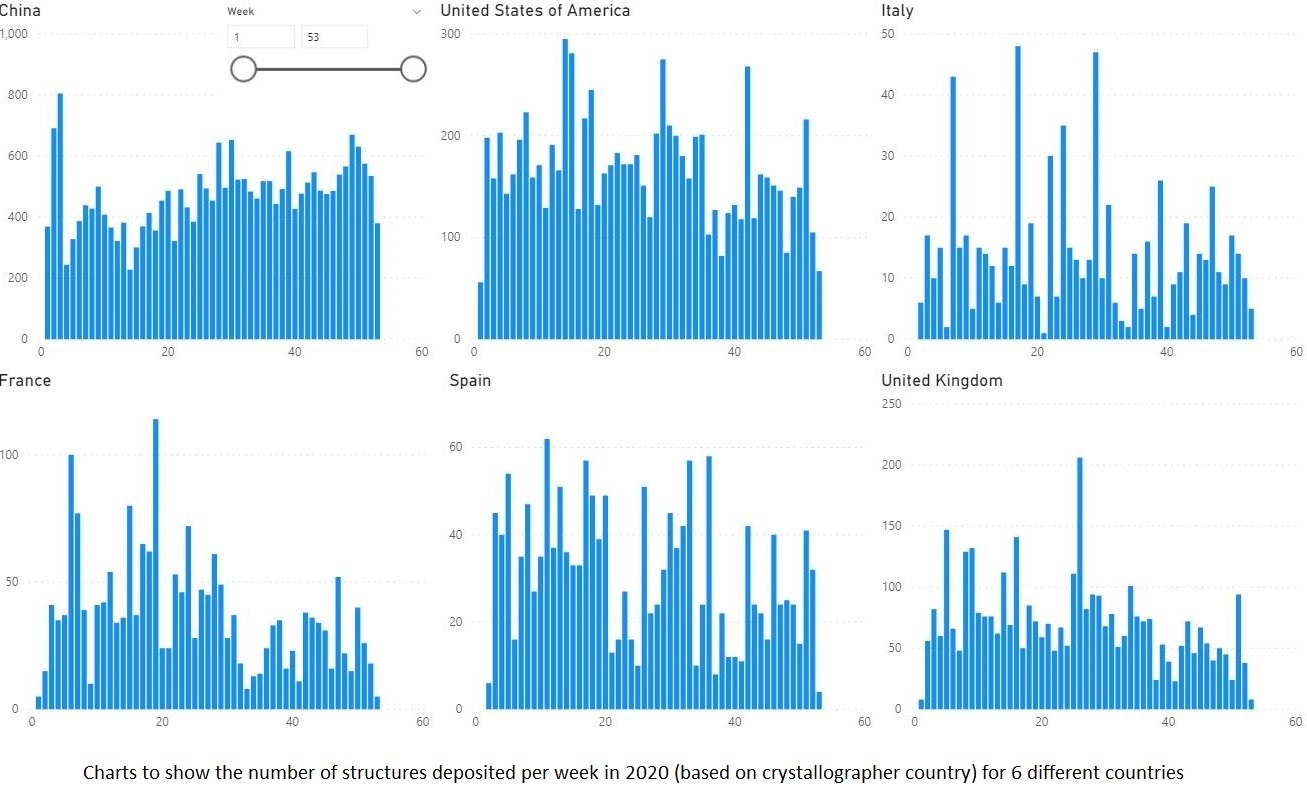
Analysing incoming data and our processes is something we do routinely but I think it is fair to say this took on a greater significance in 2020. Here are a few graphs of monthly incoming data, with some country-wise breakdowns. We wanted to make sure we were able to give the best support to everyone in our community. Along with regular analysis, we started looking more carefully at numbers in various aspects of our vast data.

As shown, we closely monitored some of the effected countries with their incoming depositions and structures. Without saying, the start of the pandemic was very challenging.
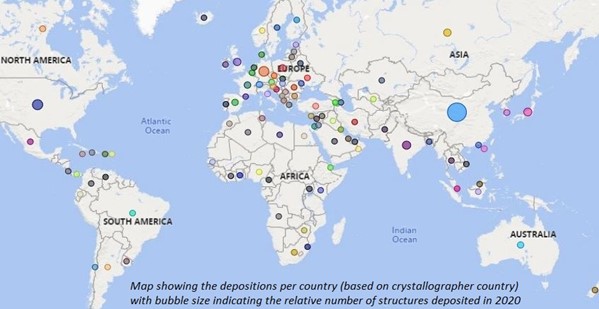
By looking at depositions per country we wanted to monitor how the unveiling COVID-19 circumstances in each country impacted the depositions we received. Some of the countries highlighted in the graphs account for a significant proportion of depositions and so if we observed a massive drop in those depositions the consequences on the CSD could be dramatic. Monitoring global depositions helped us to be more aware of what was happening, be more prepared for what was coming and better understand how we could support our global community.

For example, currently around a third of our depositions come from China and understandably as the pandemic started to unfold there, we did observe a drop in data from China. Fortunately, as you can see in the chart, deposition numbers in China have since picked up and this gives us real hope for the future. Overall, despite the ups and downs of 2020 and all the lockdowns and lab closures the global deposition numbers in 2020 were comparable to 2019. In total, we received over 51,000 new deposits and 15,000 were revised in 2020 and over 75,000 new structures deposited to the CSD. Alongside the number of structures being deposited and published in the CSD, we had over 22,500 new website registrations, published 6,500+ CSD Communications, and over half a million people used our Access Structure/WebCSD Services in 2020. We know many of you will have had to adapt to new ways of working in 2020 and collectively depositing and sharing so much data is a huge achievement.
Along with monitoring deposition numbers we have also been monitoring ourselves and analysing how much time we took at our end, to deal with your depositions and answer your queries. Despite not being in the CCDC offices we wanted to make sure our response to every query/deposit took similar or lesser time than what we achieved before the pandemic. And pleasure to say in 2020 we were able to decrease the time taken by 3%.
The push to find a cure and a vaccine for COVID-19 and the reliance on scientific data in 2020 has certainly underlined the importance of data sharing & analysis for us.
In-spite of the challenges, collectively we managed to pull through very well. And I look forward to playing my part to help you share your valuable scientific data this year too.